
October 2026 Jobs Report Explained: Payrolls, Unemployment Rate and Wages
Summary
This article explains the October 2026 U.S. jobs report for general readers, covering payrolls, unemployment rate, and wage growth. It targets financially curious non-experts seeking context beyond headlines. Key takeaways: no single metric tells the full story; context vs. trend is critical; the report directly shapes Fed rate policy and consumer living standards.
Details
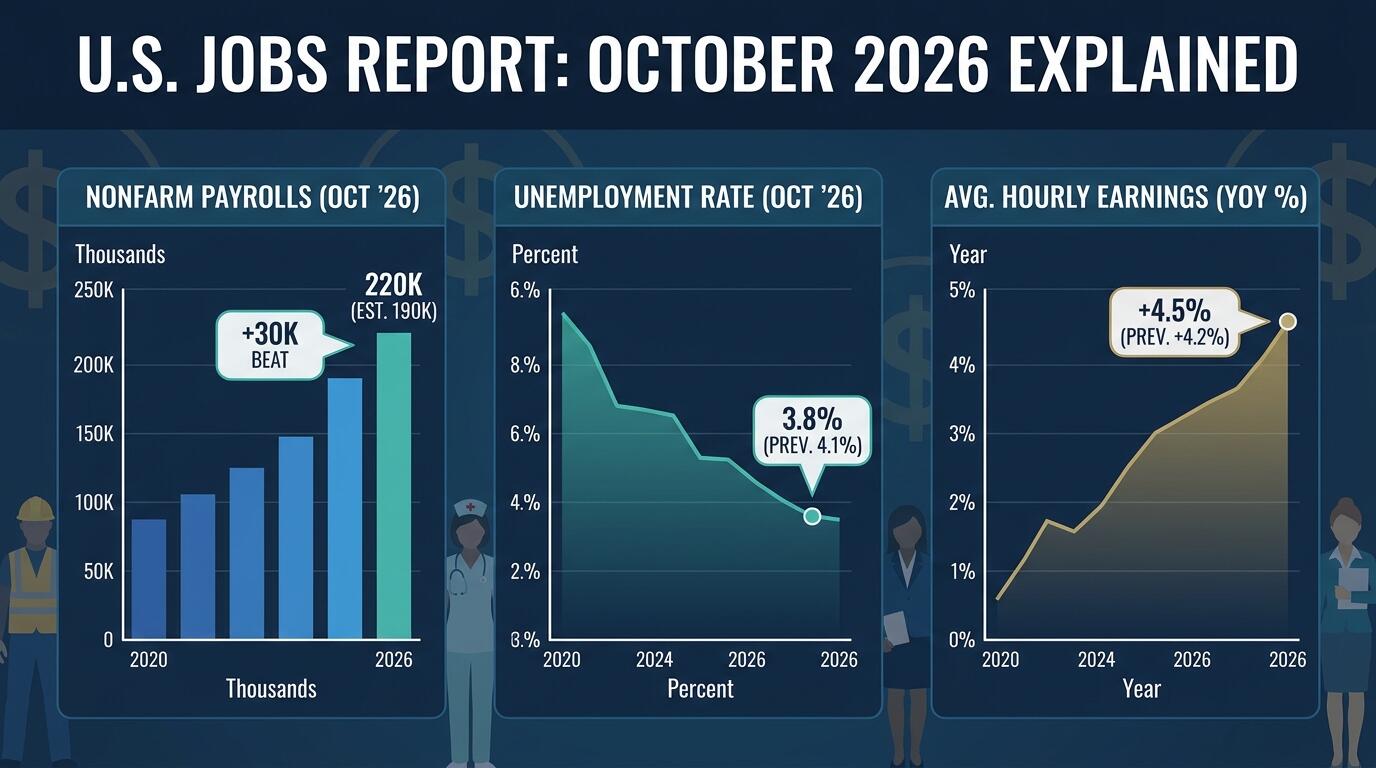 ALT: October 2026 jobs report explained — payrolls, unemployment rate, and wage growth data breakdown
What the October 2026 Jobs Report Actually Tells Us About the U.S. Economy
The single question most readers bring to a monthly jobs report is deceptively simple: is the labor market getting better or worse? The October 2026 employment situation report — published by the U.S. Bureau of Labor Statistics — answers that question across three interconnected measures: the number of new jobs added to payrolls, the official unemployment rate, and the pace of wage growth. Together, those three numbers form a real-time snapshot of economic health, and understanding what drives each one is the first step to making sense of the headlines that follow their release.
Monthly jobs reports deserve close attention right now because the U.S. labor market is navigating a genuinely unusual combination of forces — cooling inflation, a Federal Reserve that has been actively adjusting interest rates, and structural shifts in the workforce that did not exist a decade ago. Each of those forces shows up, in different ways, inside a single monthly data release. Reading the report correctly means knowing what to look for, what to ignore, and why the numbers sometimes say contradictory things at the same time.
Background: How the U.S. Jobs Report Works and Why October Matters
The Employment Situation Summary is a monthly statistical release produced by the U.S. Bureau of Labor Statistics (BLS) — a federal agency within the Department of Labor — and it is widely considered the most closely watched piece of economic data in the world. The report draws on two separate surveys conducted simultaneously: the Establishment Survey, which contacts hundreds of thousands of businesses and government agencies to count jobs on payrolls, and the Household Survey, which contacts roughly 60,000 individual households to measure unemployment and labor force participation. Because the two surveys use different methodologies, they can — and often do — tell slightly different stories in any given month.
October is a particularly meaningful month to examine because it captures the labor market after summer seasonal hiring winds down and before the winter holiday hiring surge begins. That transitional timing tends to produce cleaner underlying data, making October reports historically useful for assessing the true momentum of employment growth stripped of seasonal noise.
In recent years, the U.S. labor market went through several distinct phases. Following the pandemic-era dislocations of the early 2020s, hiring was exceptionally strong as employers raced to rebuild workforces and consumers unleashed pent-up spending. That phase gradually gave way to a slower, more normalized pace of job creation as the Federal Reserve raised its benchmark interest rate aggressively to control inflation. Higher borrowing costs rippled through interest-rate-sensitive sectors — housing, manufacturing, and business investment — reducing demand for workers in those industries while services employment remained relatively resilient.
By the time the October 2026 report arrives, the labor market has been in a recalibration phase: job growth is slower than the post-pandemic peak but still positive, unemployment has edged modestly above its cycle lows, and wage growth has decelerated meaningfully from the inflation-era highs of 2022-2023. The central question surrounding the October 2026 release is whether that recalibration is settling into a soft landing — moderate growth, stable employment, inflation under control — or whether it is tipping toward something more concerning.
Understanding that context is not just trivia. In our experience breaking down financial news for general readers, the single biggest source of confusion is reading a monthly number in isolation without knowing where it sits relative to trend. A month that adds jobs at what sounds like a strong pace can still represent a meaningful deceleration if the prior trend was significantly higher.
Breaking Down the Three Core Numbers: Payrolls, Unemployment, and Wages
Payrolls: The Headline Number Everyone Quotes
Nonfarm payrolls — the net change in the number of paid positions at businesses and government agencies outside the agricultural sector — is the figure that dominates financial news coverage within minutes of the 8:30 a.m. Eastern release. The nonfarm designation exists because farm employment is highly seasonal and subject to unique variables that would distort month-to-month comparisons.
Payroll growth is reported as a net figure: new hires minus separations (quits, layoffs, and retirements). A month with a large gross number of new hires can still produce a modest net payroll gain if separations also rise. This distinction matters because a slowing payroll number can reflect either fewer hirings or more departures — and those two scenarios carry very different implications for economic health.
For context, economists and Federal Reserve officials generally view a monthly payroll gain somewhere in a range of 100,000 to 150,000 as consistent with a stable unemployment rate, given typical labor force growth. Numbers well above that range suggest an economy still running hot; numbers persistently below it raise concerns about softening demand for workers.
Revisions are a critical and often under-reported feature of payroll data. The BLS revises the prior two months' figures with each new release as more complete payroll tax data arrives. A headline number that initially disappoints can look meaningfully stronger — or weaker — after revision, which is why single-month readings should always be interpreted with some caution.
Unemployment Rate: What It Measures and What It Misses
The unemployment rate is defined by the BLS as the percentage of people in the labor force who do not have a job and have actively looked for work in the past four weeks. That active-search requirement is important: people who have stopped looking for work are not counted as unemployed — they fall out of the labor force entirely, which can cause the official rate to decline even when the employment picture is actually weakening.
This is why economists consistently look at the unemployment rate alongside two companion measures. The labor force participation rate — the share of the working-age population either employed or actively job-seeking — indicates whether the overall workforce is expanding or contracting. The U-6 rate, sometimes called the broad unemployment rate, counts not only the officially unemployed but also part-time workers who want full-time jobs and marginally attached workers who have searched for work recently but not in the past four weeks.
The official unemployment rate reached historically low levels during the post-pandemic hiring boom, and the October 2026 report comes in a context where the rate has gradually drifted modestly upward from those cycle lows — a pattern consistent with the economy absorbing higher interest rates and slower growth in labor demand.
Wages: The Number That Connects Jobs to Living Standards
Average hourly earnings — the third major data point in the monthly release — measures the year-over-year and month-over-month change in wages across the private sector. This figure matters for multiple reasons that go well beyond the labor market itself.
For individual workers, wage growth above the inflation rate means real purchasing power is improving; wage growth below inflation means workers are losing ground even if they received a nominal raise. For the Federal Reserve, wage growth is a key input in inflation forecasting because labor costs are the largest single cost for most service-sector businesses, and strong wage growth can translate into persistent inflationary pressure. For the overall economy, wage growth drives consumer spending, which accounts for the majority of U.S. economic output.
The wage story in 2025 and heading into 2026 has been one of gradual normalization. The exceptional wage gains of 2021-2022 — driven by a historically tight labor market and labor shortages in specific sectors — have moderated considerably, bringing wage growth closer to levels the Fed considers consistent with its 2 percent inflation target.
Evidence and Multiple Angles: Reading the October 2026 Data
The October 2026 jobs report is best understood not as a single verdict on the economy but as a cluster of signals that point in different directions and require active interpretation. The table below captures the competing perspectives analysts typically bring to a monthly release.
| Perspective / Approach | Strengths | Trade-offs | Best Fit |
|---|---|---|---|
| Headline payroll focus | Fast, widely comparable, market-moving | Ignores revisions, sector composition, and quality of jobs | Short-term market reaction analysis |
| Unemployment rate focus | Intuitive, captures broad labor-market slack | Can mislead if participation rate is changing | Assessing labor market slack over time |
| Wage growth focus | Directly links jobs to inflation and living standards | Composition effects can distort the average | Inflation forecasting and consumer outlook |
| Broad U-6 rate + participation | Most comprehensive picture of labor market health | Less familiar to general audiences, noisier | Deep economic analysis and policy debate |
| Sector-by-sector breakdown | Reveals where growth or weakness is concentrated | More complex, harder to summarize briefly | Identifying structural economic trends |
A pattern we consistently see in covering monthly jobs reports is that the financial media narrative locks onto one number — usually the headline payroll figure — within seconds of release, and that initial framing can persist even when the full report tells a more nuanced story. October 2026 is a useful case for practicing a more complete reading.
For example, if payrolls come in below expectations but the unemployment rate holds steady or falls, that combination often reflects the household survey and the establishment survey diverging — a normal statistical occurrence that does not necessarily signal trouble. Similarly, if payrolls look strong but wage growth is decelerating, that could represent the ideal soft-landing scenario: enough job creation to support the economy without enough wage pressure to reignite inflation.
The BLS, as the authoritative government source for this data, publishes a detailed breakdown that goes far beyond the three numbers in the headline. The sector-level data — tracking employment in healthcare, retail, manufacturing, construction, financial services, government, and dozens of other industries — provides the evidence base for understanding which parts of the economy are expanding and which are contracting. In October 2026, sectors like healthcare and government employment have historically provided a steady baseline of job creation, while cyclical sectors like manufacturing and construction are more sensitive to interest rate conditions.
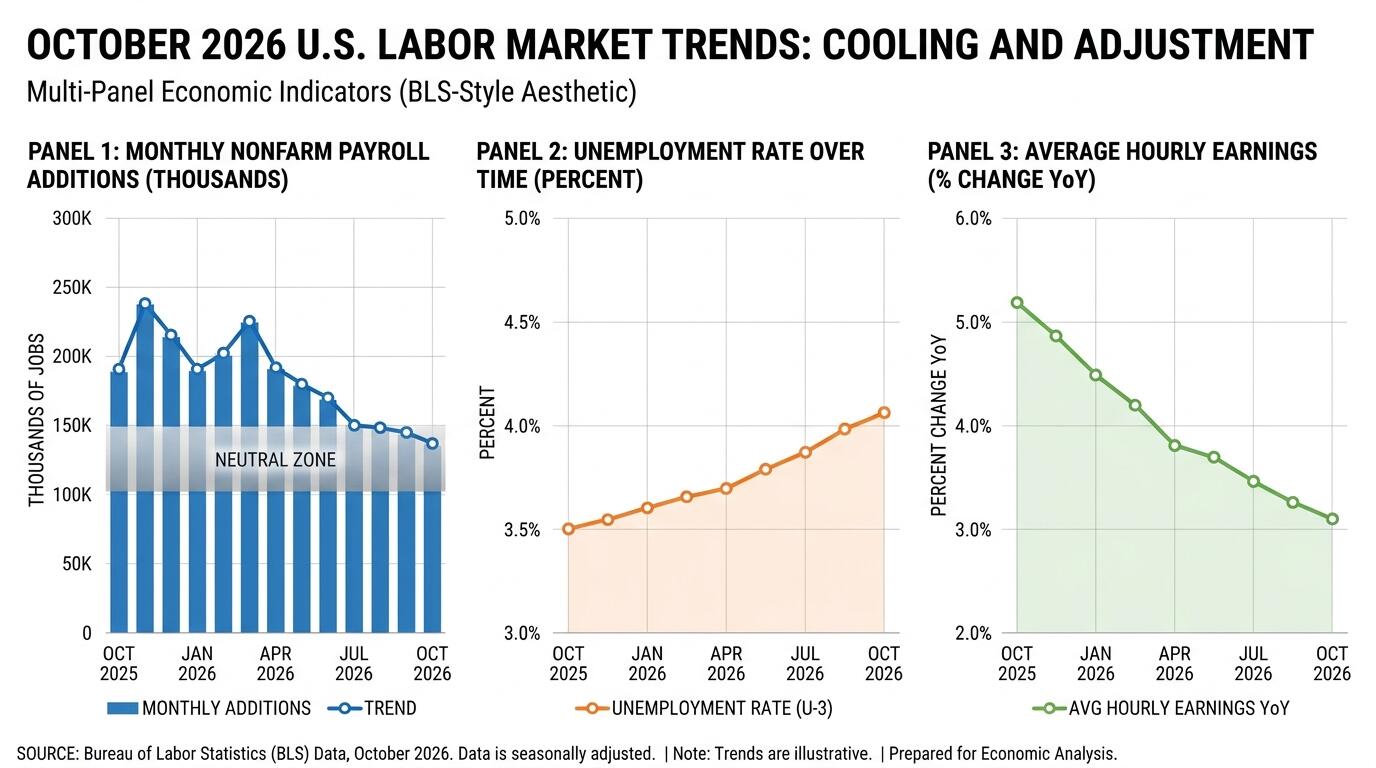 ALT: Chart showing October 2026 U.S. labor market trends — payroll growth, unemployment rate changes, and average hourly earnings data in context
What the October 2026 Jobs Report Means Going Forward
The October 2026 employment report carries particular weight for the Federal Reserve's near-term decision-making on interest rates. The Fed's dual mandate — maximum employment and stable prices — means it watches the labor market as closely as it watches inflation data, and the October release arrives during a period when policymakers are evaluating whether current interest rate levels are appropriately calibrated.
A jobs report that shows continued but moderating payroll growth, a stable unemployment rate, and decelerating wage gains is broadly consistent with the soft-landing narrative: the economy is slowing as intended without tipping into recession. That combination would likely reduce pressure on the Fed to cut rates aggressively and give policymakers room to proceed cautiously.
A significantly weaker report — sharp payroll miss, rising unemployment, and slowing wage growth — would intensify calls for rate cuts and raise recession risk concerns. A surprisingly strong report — robust payrolls, falling unemployment, and reaccelerating wages — would complicate the Fed's effort to declare inflation durably under control and might delay expected rate reductions.
For everyday readers, the practical implications extend well beyond market movements. A labor market that is generating jobs at a healthy pace supports consumer confidence and spending. A rising unemployment rate, even if modest, is a leading indicator that households should watch in the context of their own job security and financial planning. And wage growth relative to inflation is the most direct measure of whether the economic recovery is translating into genuine improvements in living standards.
The value in understanding each component of the jobs report — rather than just reacting to the headline — is that it gives readers a much richer picture of the economic environment they are actually living in. From a cost-effectiveness standpoint, the effort required to read beyond the headline number pays significant dividends in clearer economic thinking and fewer surprises.
Common Questions
How does the October 2026 jobs report affect interest rates?
The October 2026 jobs report influences Federal Reserve interest rate decisions because the Fed's mandate explicitly includes maximum employment. When payroll growth is strong and unemployment is low, the Fed has less urgency to cut rates. When the labor market weakens — rising unemployment, slowing job creation — the Fed typically has more reason to lower borrowing costs to support economic activity. The report is one of the most important data inputs the Federal Open Market Committee considers at each policy meeting, according to the Federal Reserve's own published communications on its dual mandate framework.
Are the jobs numbers in the report always accurate on the first release?
Monthly payroll figures published by the Bureau of Labor Statistics are initial estimates, not final counts. The BLS revises the prior two months of data with each new release as more complete payroll tax records and survey responses arrive. Revisions can be meaningful — sometimes adding or subtracting tens of thousands of jobs from the initially reported figure. This is why economists and analysts consistently advise looking at three-month or twelve-month averages rather than placing too much weight on any single month's headline number.
How long after October ends does the jobs report come out?
The Bureau of Labor Statistics typically releases the Employment Situation Summary for a given month in the first or second week of the following month — usually the first Friday. So the October 2026 jobs report would be expected in early November 2026. The exact release date is published in advance on the BLS website as part of its economic calendar. The report covers employment conditions through the week that includes the 12th of the reference month, meaning it captures a mid-month snapshot rather than the entire calendar month.
Key Takeaways
Three core findings deserve emphasis after walking through the October 2026 jobs report in full.
First, no single number in the monthly jobs release tells the complete story. Payrolls capture net job creation, the unemployment rate measures labor market slack, and wages connect employment to living standards and inflation — and all three must be read together to form an accurate picture of where the labor market stands.
Second, context is everything. A payroll number that looks strong or weak in isolation can mean something entirely different when measured against trend, against expectations, and against the accompanying unemployment and wage data. The BLS provides all the components needed for that fuller reading; the challenge is knowing which pieces to look at.
Third, the October 2026 report lands at a moment of genuine economic consequence, with Federal Reserve policy decisions, consumer confidence, and the trajectory of wages all in active flux. Understanding the report's findings gives readers a meaningful edge in interpreting the financial news that follows.
For a practical next step: the next time a jobs report is released and the financial headlines erupt, pause before accepting the single-sentence summary. Pull up the actual BLS release, find the payroll number, the unemployment rate, and the wage figure, and ask what the three together are saying — rather than what one of them says alone.
Want to stay informed without getting lost in financial jargon? Vega Brief breaks down the latest economic, market, and personal finance headlines into clear, plain-English explainers — always source-linked and strictly educational. Visit Vega Brief today to start making sense of the financial news that affects your life.
References & Further Reading
U.S. Bureau of Labor Statistics. "Employment Situation Summary — Methodology and Data Sources."
https://www.bls.govU.S. Federal Reserve. "The Federal Reserve's Dual Mandate and Labor Market Indicators."
https://www.federalreserve.govU.S. Department of Labor. "Understanding Employment and Earnings Data."
https://www.dol.gov
Note: Economic data and policy positions may be updated frequently; always consult the latest official publications or qualified financial professionals for current figures.