



Q1 2026 GDP Growth Accelerates to 2.0% | Cross-Border Sellers Face Inflation Headwinds
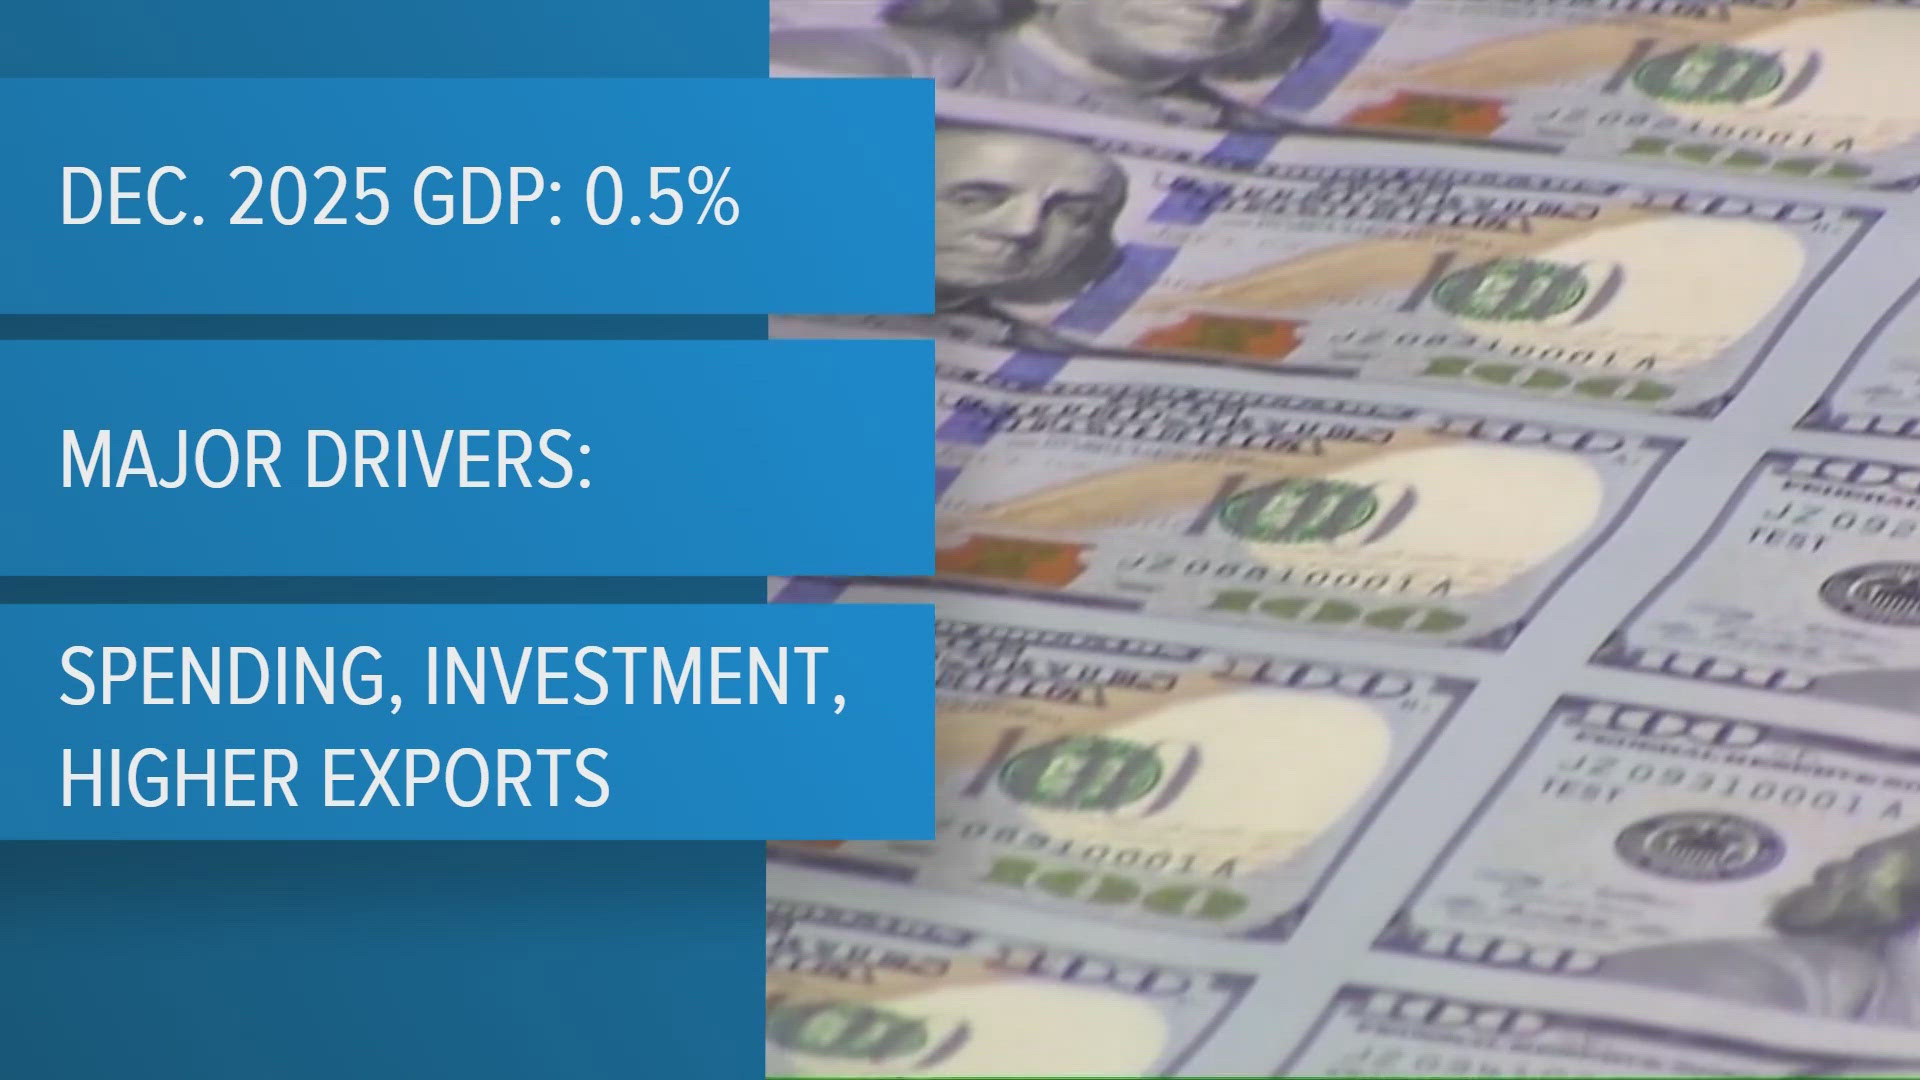
- Real GDP growth doubles from Q4 2025 (0.5% to 2.0%), but PCE inflation surges 4.5%, pressuring seller margins across tech, exports, and healthcare categories










Overview
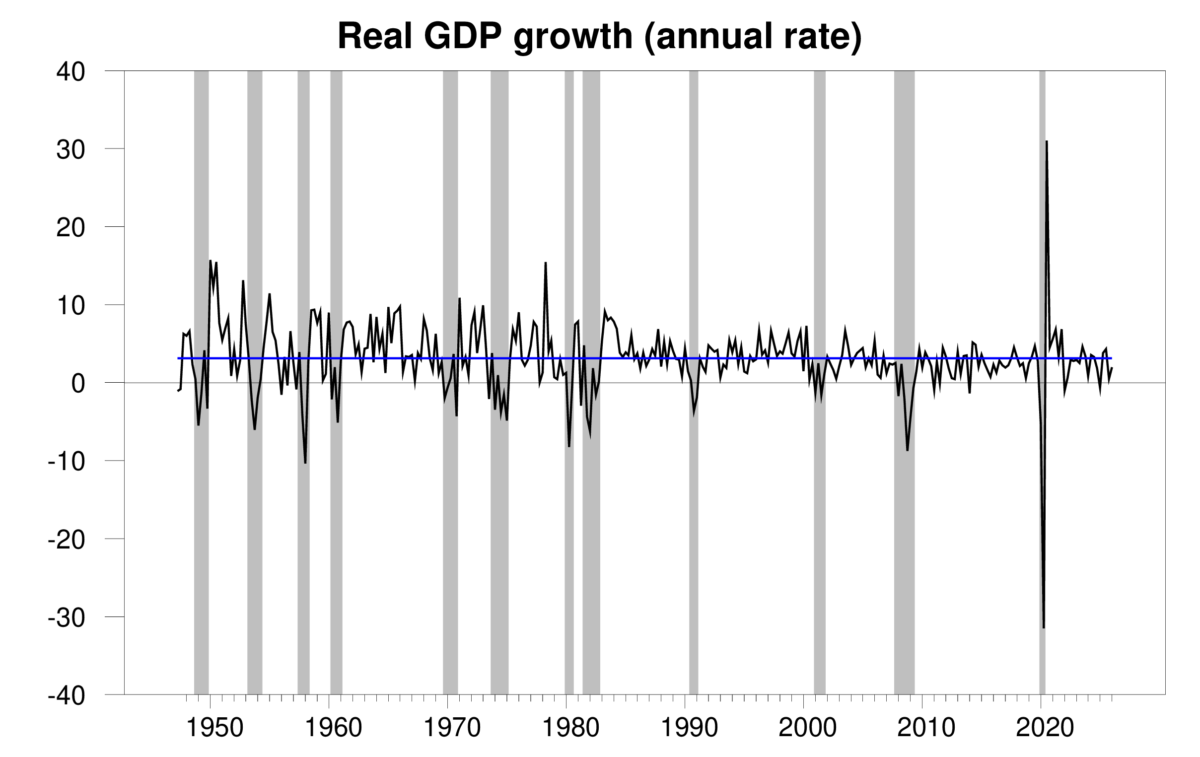
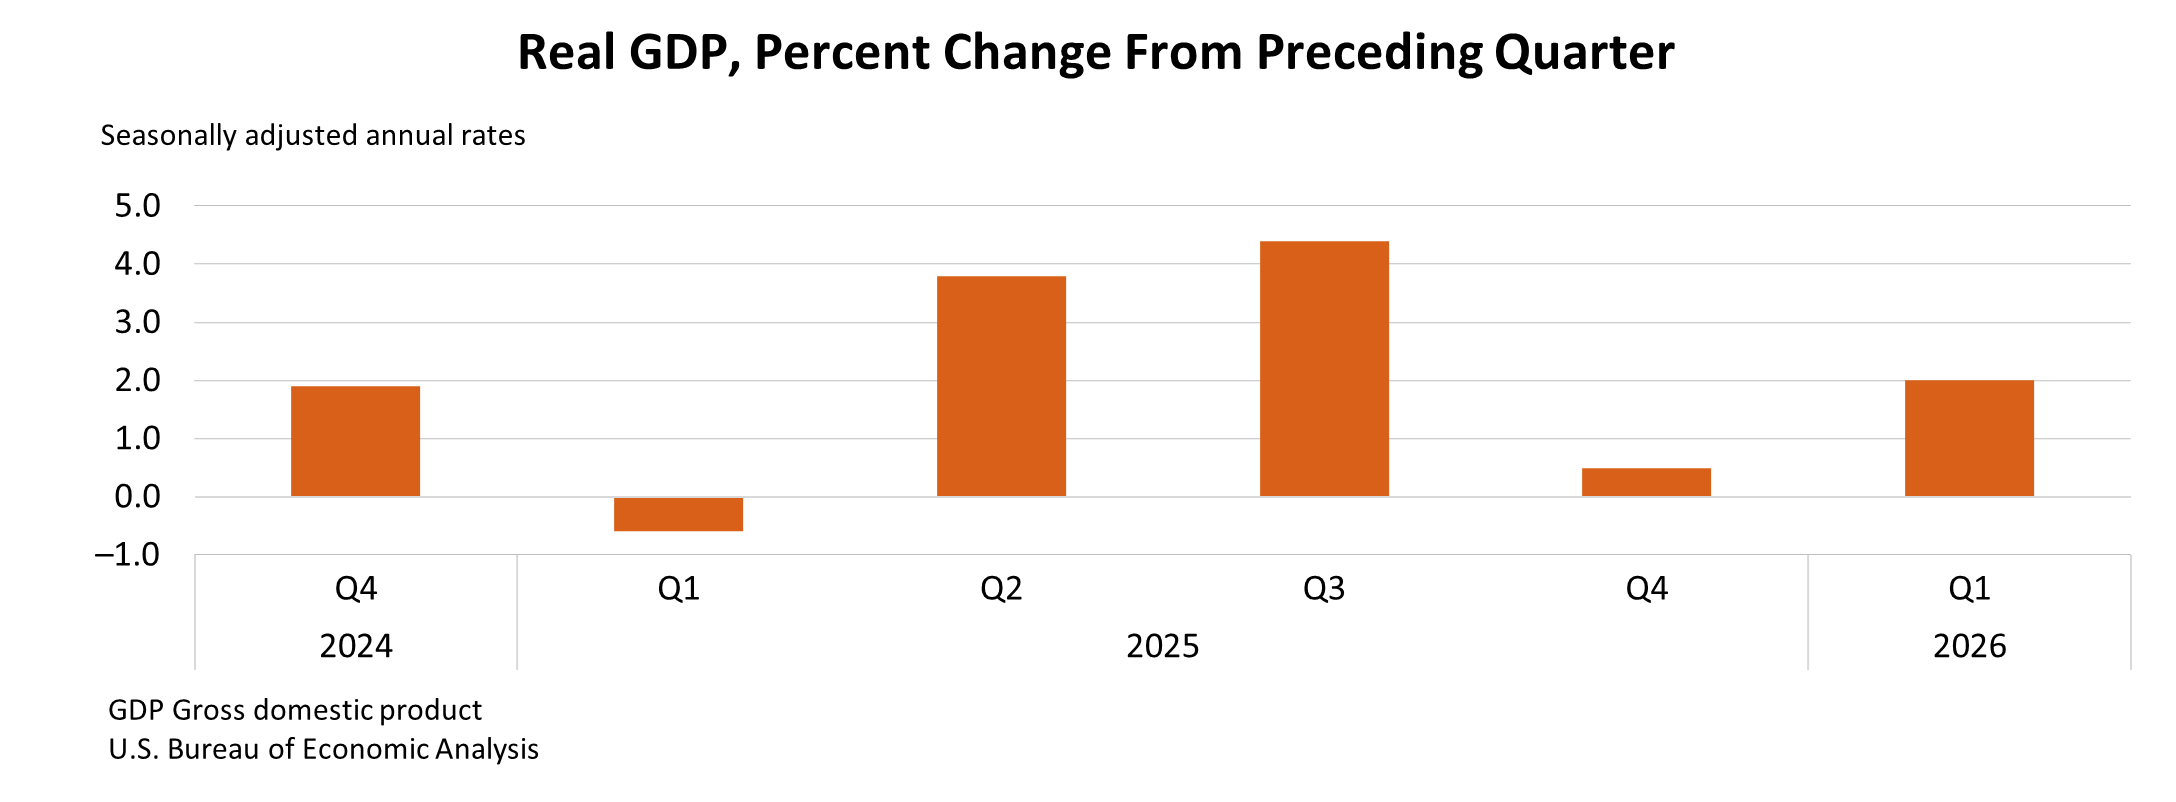
The U.S. Bureau of Economic Analysis released Q1 2026 GDP data showing real gross domestic product growth accelerated to 2.0% annually (January-March 2026), more than quadrupling the 0.5% growth from Q4 2025. This represents a critical inflection point for cross-border e-commerce sellers, driven by strengthening domestic demand and export opportunities, but complicated by significant inflation pressures that directly impact cost structures and pricing strategies.
Seller Opportunity: Export-Driven Growth and Category Tailwinds
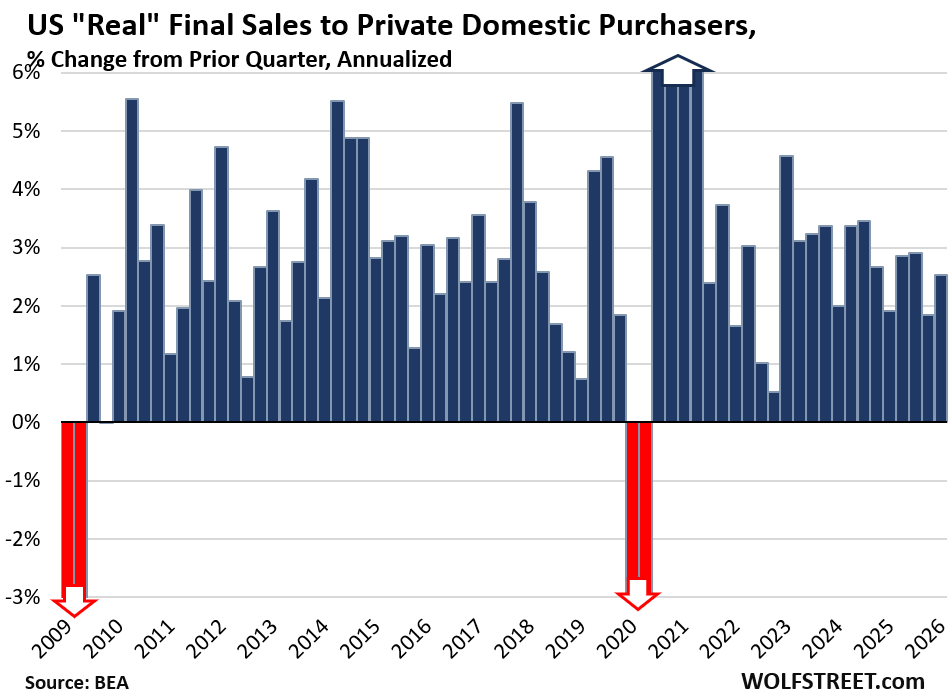
The acceleration reflects real final sales to private domestic purchasers growing 2.5% versus 1.8% in Q4 2025, signaling robust consumer purchasing power. Investment growth was specifically driven by information processing equipment (computers, peripherals), software, and retail/wholesale inventory increases—categories where cross-border sellers maintain significant market share. Export growth was led by goods including computers, peripherals, and industrial supplies, creating direct opportunities for sellers in electronics, IT accessories, and B2B supply categories. Consumer spending increases were primarily driven by healthcare services, indicating strong demand in health-related product categories (supplements, medical devices, wellness equipment) where e-commerce penetration continues expanding. For Amazon FBA sellers and Shopify merchants, this signals sustained demand in tech accessories, computer peripherals, and health/wellness categories through Q2 2026.
Critical Challenge: Inflation Compression and Pricing Pressure
However, the economic acceleration masks a severe inflation problem threatening seller profitability. The PCE price index jumped 4.5% in Q1 2026 versus 2.9% in Q4 2025—a 1.6 percentage point acceleration—while core PCE (excluding food/energy) rose 4.3% versus 2.7%, indicating broad-based cost pressures beyond commodity inputs. The gross domestic purchases price index increased 3.6%, affecting import costs, logistics, and inventory valuation. Current-dollar GDP grew 5.6%, but this masks the reality: nominal growth (5.6%) significantly outpaces real growth (2.0%), meaning price increases account for 3.6 percentage points of headline growth. For sellers with thin margins (5-15% typical in electronics/apparel), this inflation surge directly compresses profitability. Tariff implications are also critical: the BEA referenced Supreme Court determinations regarding tariff refunds under the International Emergency Economic Powers Act in February 2026, suggesting ongoing tariff volatility that affects import-dependent sellers.
Operational Impact by Seller Segment
Small sellers (under $500K annual revenue) face immediate margin compression: if COGS inflation averages 4-5% but pricing power remains limited to 2-3% due to competitive pressure, net margins compress 200-300 basis points. Mid-market sellers ($500K-$5M) can leverage inventory optimization—the data shows retail/wholesale inventory increases, suggesting platform inventory levels are rising, which may create Buy Box opportunities for well-stocked sellers. Large sellers ($5M+) should monitor the tariff refund situation closely, as the Supreme Court determination could unlock significant cash recovery or create unexpected liabilities depending on import timing and tariff classification.
Questions 7
How will the May 28 2026 second GDP estimate impact seller strategy?
The BEA will release the second (revised) GDP estimate on May 28, 2026, which typically includes updated inflation data, tariff impact assessments, and revised growth figures. This revision could significantly alter the inflation outlook and tariff implications for sellers. Sellers should plan major inventory purchases and pricing adjustments after May 28 rather than before, to incorporate revised inflation expectations. If the second estimate shows inflation moderating below 4.5%, sellers can hold prices steady; if inflation accelerates, immediate price increases become necessary. Set calendar reminders for May 28 to review the revised data and adjust Q2/Q3 inventory and pricing strategies accordingly.
What pricing strategy should sellers adopt amid 4.5% inflation?
With PCE inflation at 4.5% and core inflation at 4.3%, sellers face a pricing dilemma: raising prices 4-5% risks losing Buy Box and conversion rate drops of 10-20%, while absorbing costs reduces margins by 200-300 basis points. Optimal strategy: implement tiered pricing increases (2-3% on high-velocity SKUs, 4-6% on lower-competition items), bundle products to justify higher price points, and shift mix toward higher-margin categories (healthcare, software, services). Monitor competitor pricing weekly using tools like Keepa or Jungle Scout. For Amazon sellers, test price elasticity on 10-15% of SKUs before broad rollout. For Shopify merchants, use dynamic pricing tools to adjust based on demand signals.