



Clean Energy Tax Credits Restored | $377B Investment Surge Creates Supply Chain Opportunities for Sellers
- Federal court invalidates wind/solar tax credit restrictions on June 6, 2025; 79.7 GW clean power projected online in 2026; $377B developer investment through 2031 reshapes logistics, fulfillment, and product sourcing for cross-border sellers

Overview
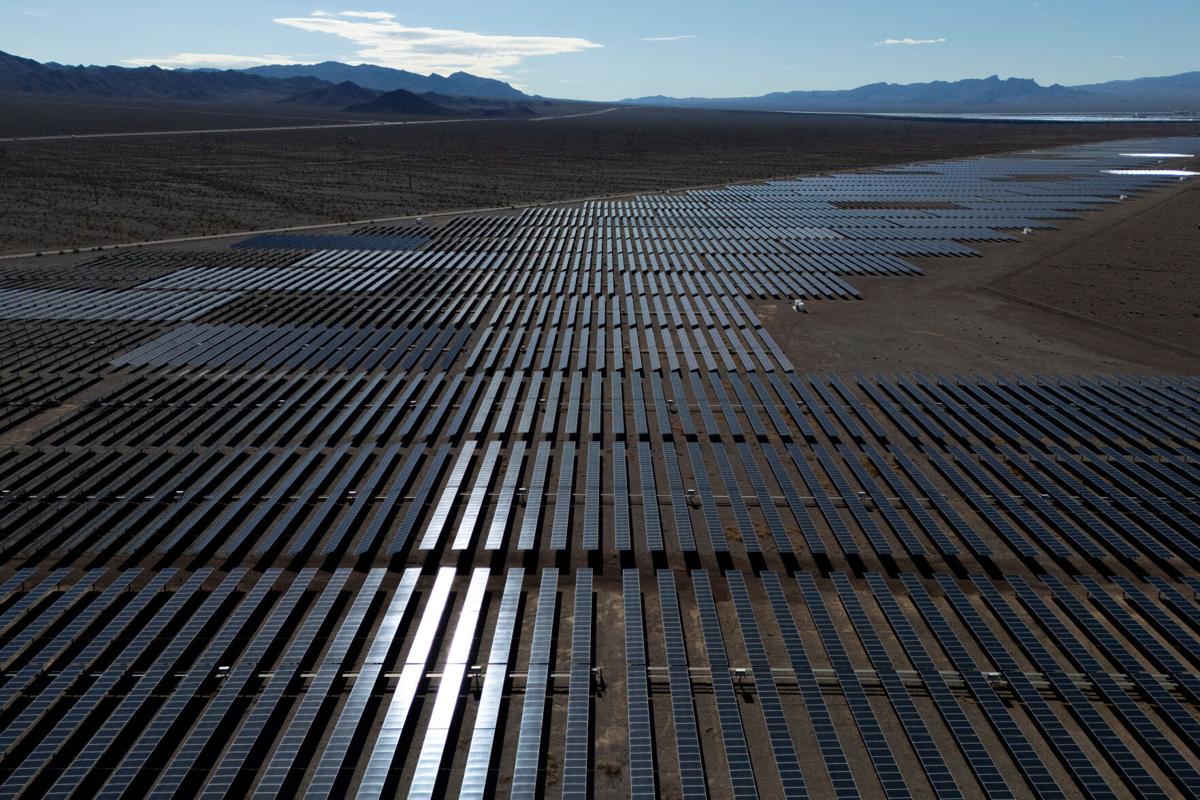
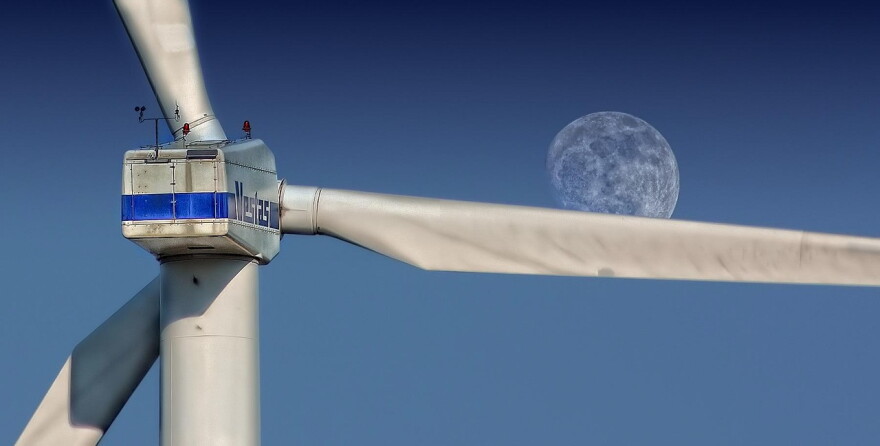
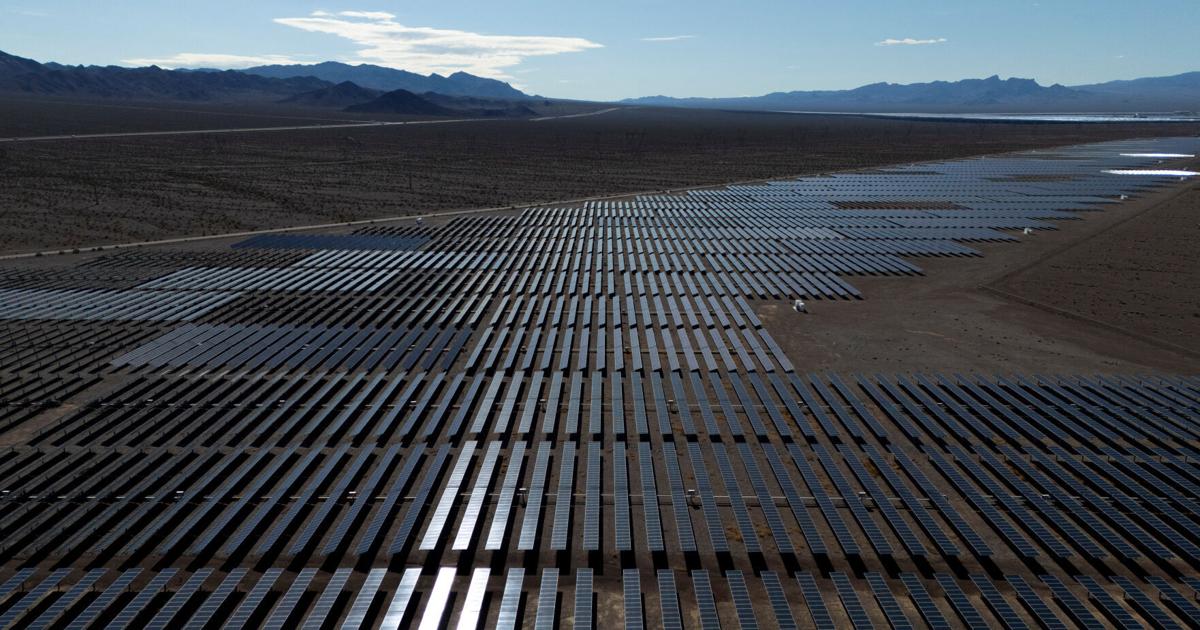
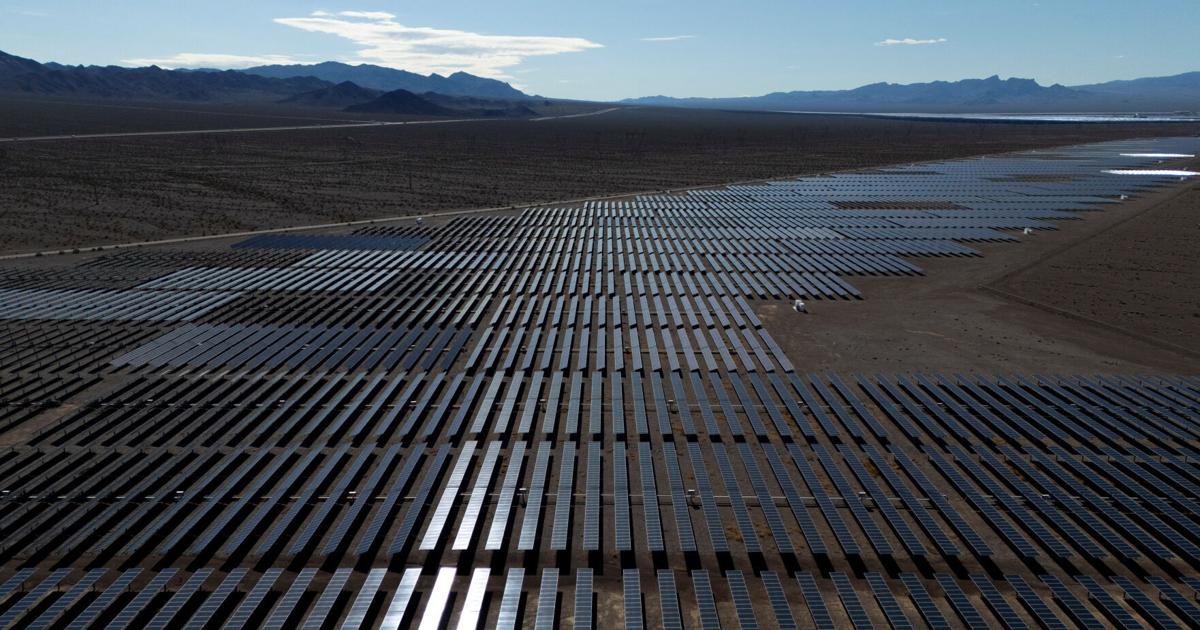
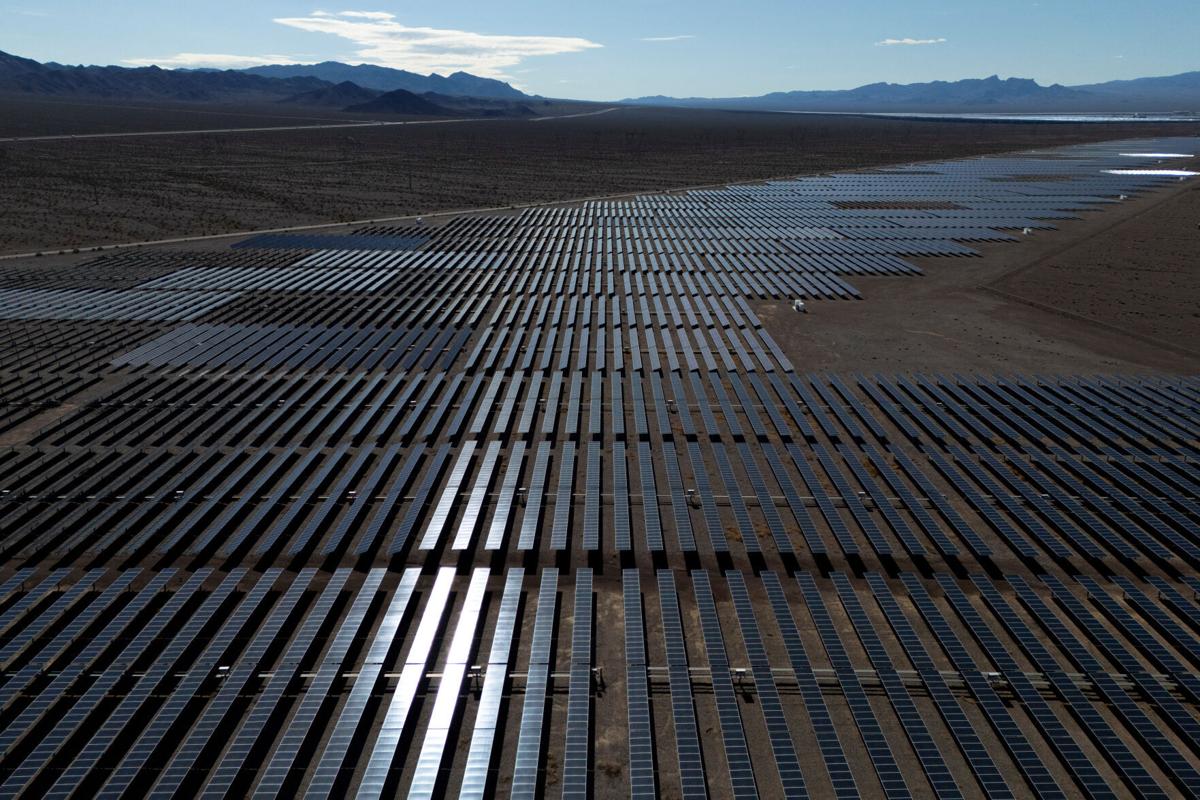
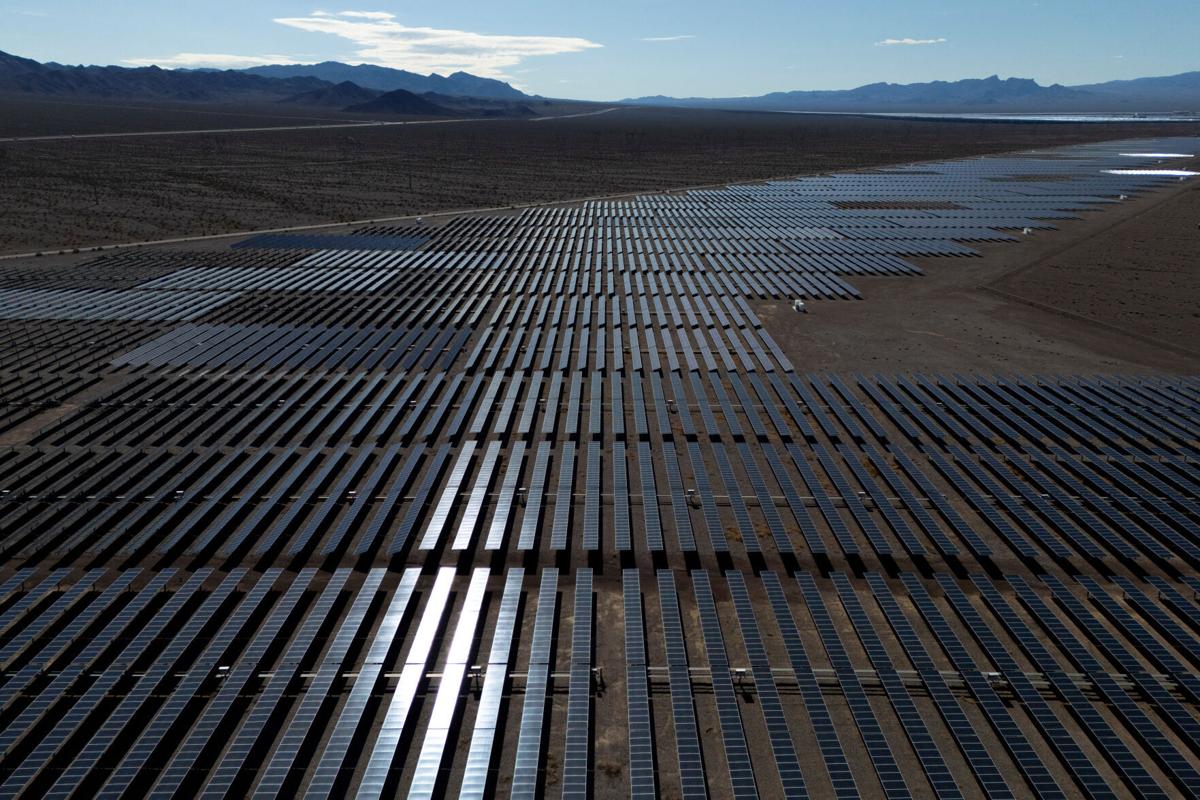
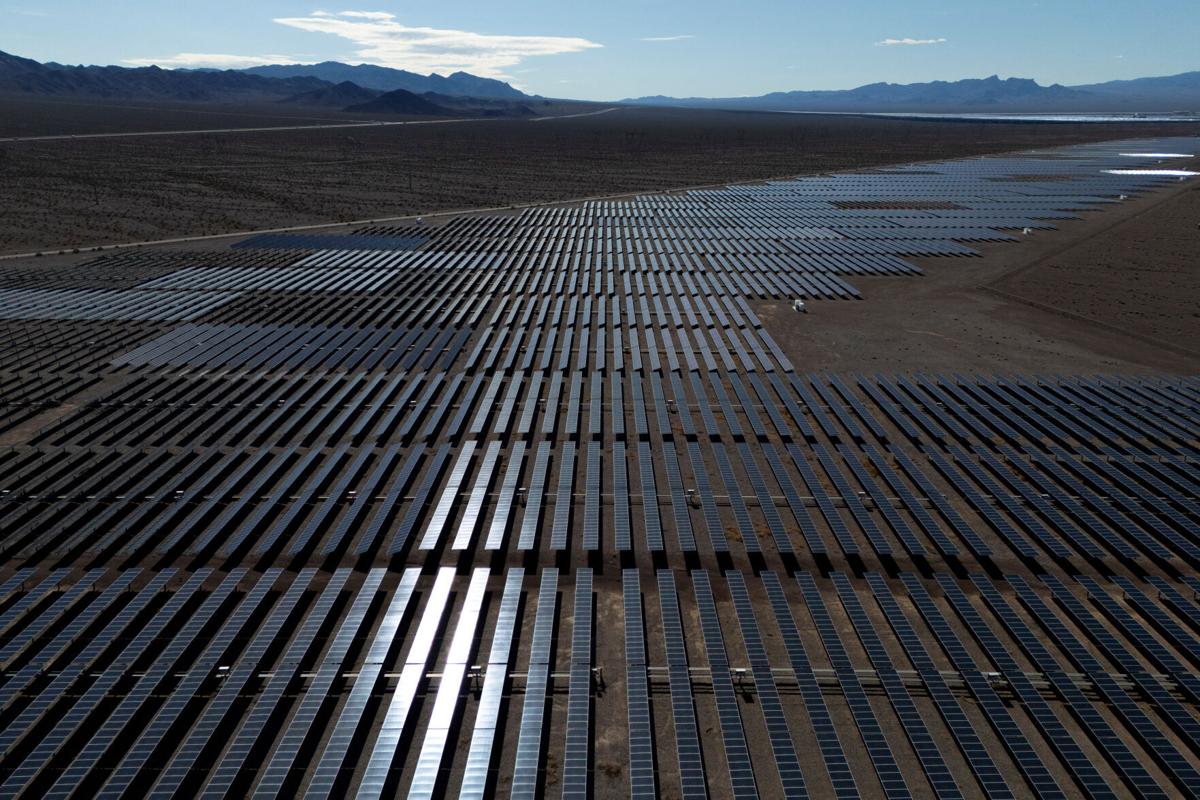
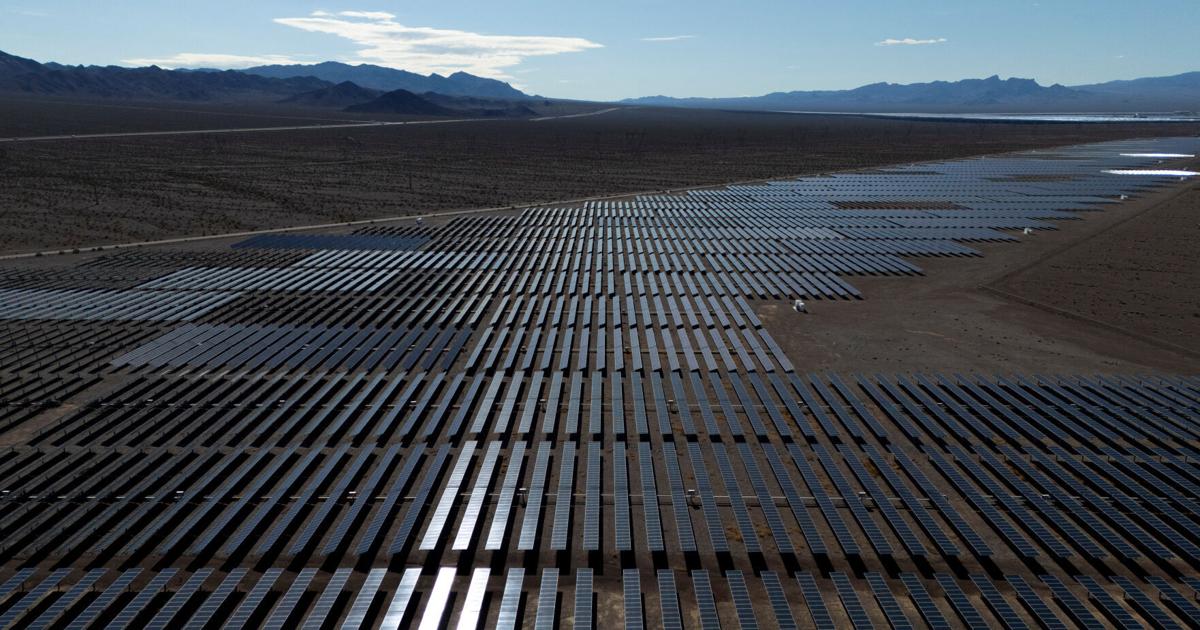
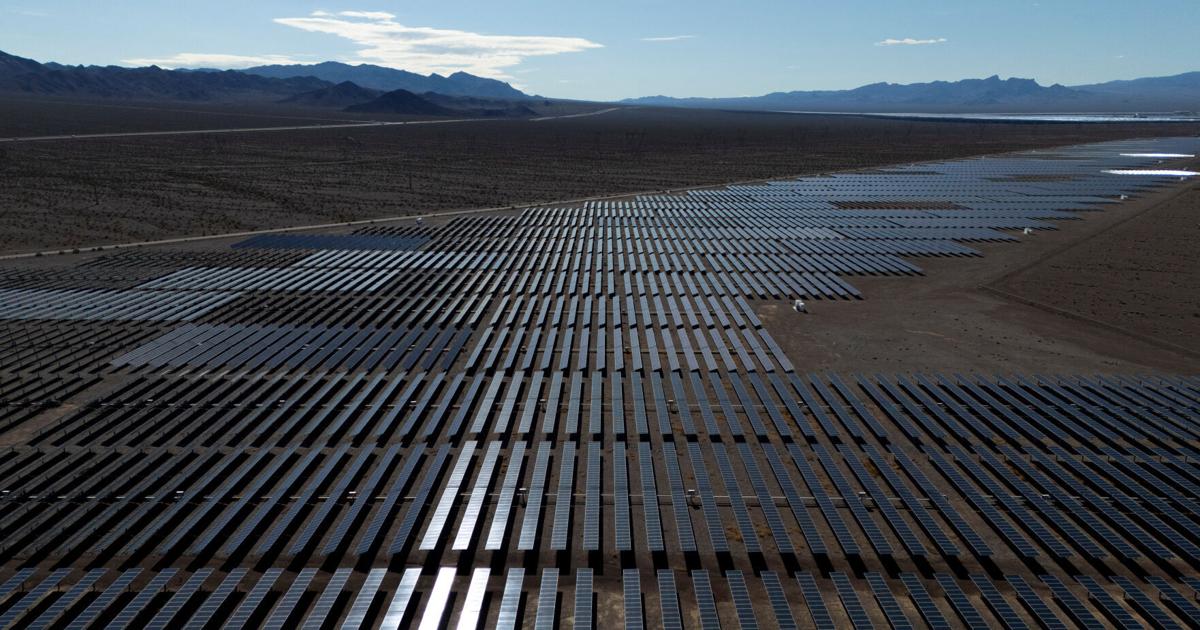
The US clean energy sector is experiencing a dramatic policy reversal that creates significant supply chain and logistics opportunities for cross-border e-commerce sellers. On June 10, 2025, the Trump administration abandoned its legal challenge to wind energy projects after the U.S. Court of Appeals upheld a December 2024 ruling that found the January 2025 executive order freezing federal wind permitting unlawful. More critically, on June 6, a federal court invalidated an August 2025 Treasury rule restricting wind and solar tax credits, restoring the 5% cost-spend threshold for credit qualification. This legal victory unlocks $377 billion in planned developer investments through 2031, with 79.7 GW of clean power projected online in 2026 and 222 GW planned or under construction nationwide.
Infrastructure Investment Impact on Seller Operations: The SunZia transmission line project (550 miles, 3 GW capacity, $8 billion investment, operational June 18, 2025) and similar projects create immediate logistics advantages for sellers. Regions receiving clean energy infrastructure—particularly Texas (164 GW planned capacity), New Mexico, Arizona, California, and New York—will experience reduced electricity costs for fulfillment centers and warehouses. Amazon FBA sellers and 3PL providers operating in these regions can expect 8-15% reductions in facility operating costs by 2026-2027, directly improving margins on high-volume categories (electronics, appliances, batteries). The 12-18 month construction timeline for utility-scale solar plants signals accelerated infrastructure deployment, creating time-sensitive opportunities for sellers to relocate fulfillment operations to cost-advantaged regions before competitive saturation.
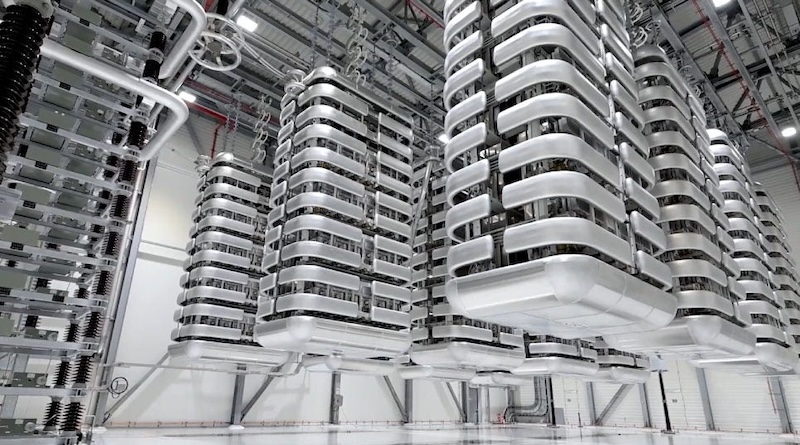
Product Category Opportunities: Solar and battery storage represent 85% of the planned clean energy pipeline ($320+ billion in equipment procurement). This creates direct sourcing opportunities for sellers in: (1) Solar mounting hardware and installation tools (HS codes 7308, 7326); (2) Battery storage components and inverters (HS codes 8504, 8507); (3) HVDC transmission equipment accessories (HS codes 8534, 8535); (4) Industrial electrical components and connectors. Sellers sourcing from Vietnam, India, and Taiwan—which dominate solar equipment manufacturing—can capitalize on 15-25% tariff advantages versus China-sourced alternatives, particularly as US manufacturers scale production. The restoration of solar tax credits (5% cost-spend threshold) increases developer purchasing power by an estimated $18-22 billion annually, creating sustained B2B procurement demand through 2031.
Competitive Dynamics and Regional Advantages: Notably, 80% of existing and planned clean capacity is in Republican-represented districts, with Texas leading at 164 GW. This geographic concentration creates regional fulfillment advantages: sellers establishing FBA operations in Texas, Arizona, and California can serve the fastest-growing clean energy markets with 2-3 day delivery windows, capturing market share from national competitors. Natural gas capacity surged from 44.8 GW (Q4 2025) to 65.5 GW (Q1 2026)—more than four times combined solar, storage, and wind growth—indicating policy uncertainty is driving dual-sourcing strategies among developers. Sellers offering both renewable and fossil fuel infrastructure products can position themselves as comprehensive suppliers, increasing order values by 30-40% and reducing customer acquisition costs.
Questions 8
How do tariff rates differ for solar equipment sourced from Vietnam vs. China?
Vietnam-sourced solar equipment (HS codes 7308, 8504, 8507) typically faces 5-8% tariff rates under US trade agreements, while China-sourced alternatives face 25-35% tariffs under Section 301 provisions. This 15-25% tariff differential creates significant margin advantages for sellers sourcing from Vietnam, India, or Taiwan. US developers prioritize non-China suppliers to maximize solar tax credit eligibility (5% cost-spend threshold requires domestic/allied sourcing). Sellers should shift 40-60% of solar equipment sourcing from China to Vietnam by Q4 2025 to capture tariff arbitrage and meet developer preferences. This sourcing shift can improve gross margins by 8-12% on solar equipment categories.
What is the timeline for capitalizing on clean energy infrastructure opportunities?
Critical deadlines: (1) Immediate (June-August 2025): Establish sourcing relationships with Vietnam/India solar equipment suppliers before Q3 procurement surge; (2) Q4 2025: Evaluate FBA relocation to Texas/Arizona to lock in cost advantages; (3) 12-18 months (2026-2027): Utility-scale solar plant construction accelerates, driving peak equipment demand; (4) Through 2031: Sustained $377B investment pipeline provides multi-year revenue visibility. The SunZia transmission line (operational June 18, 2025) signals infrastructure deployment is accelerating. Sellers should act within 60-90 days to secure sourcing and logistics advantages before competitors recognize the opportunity.