


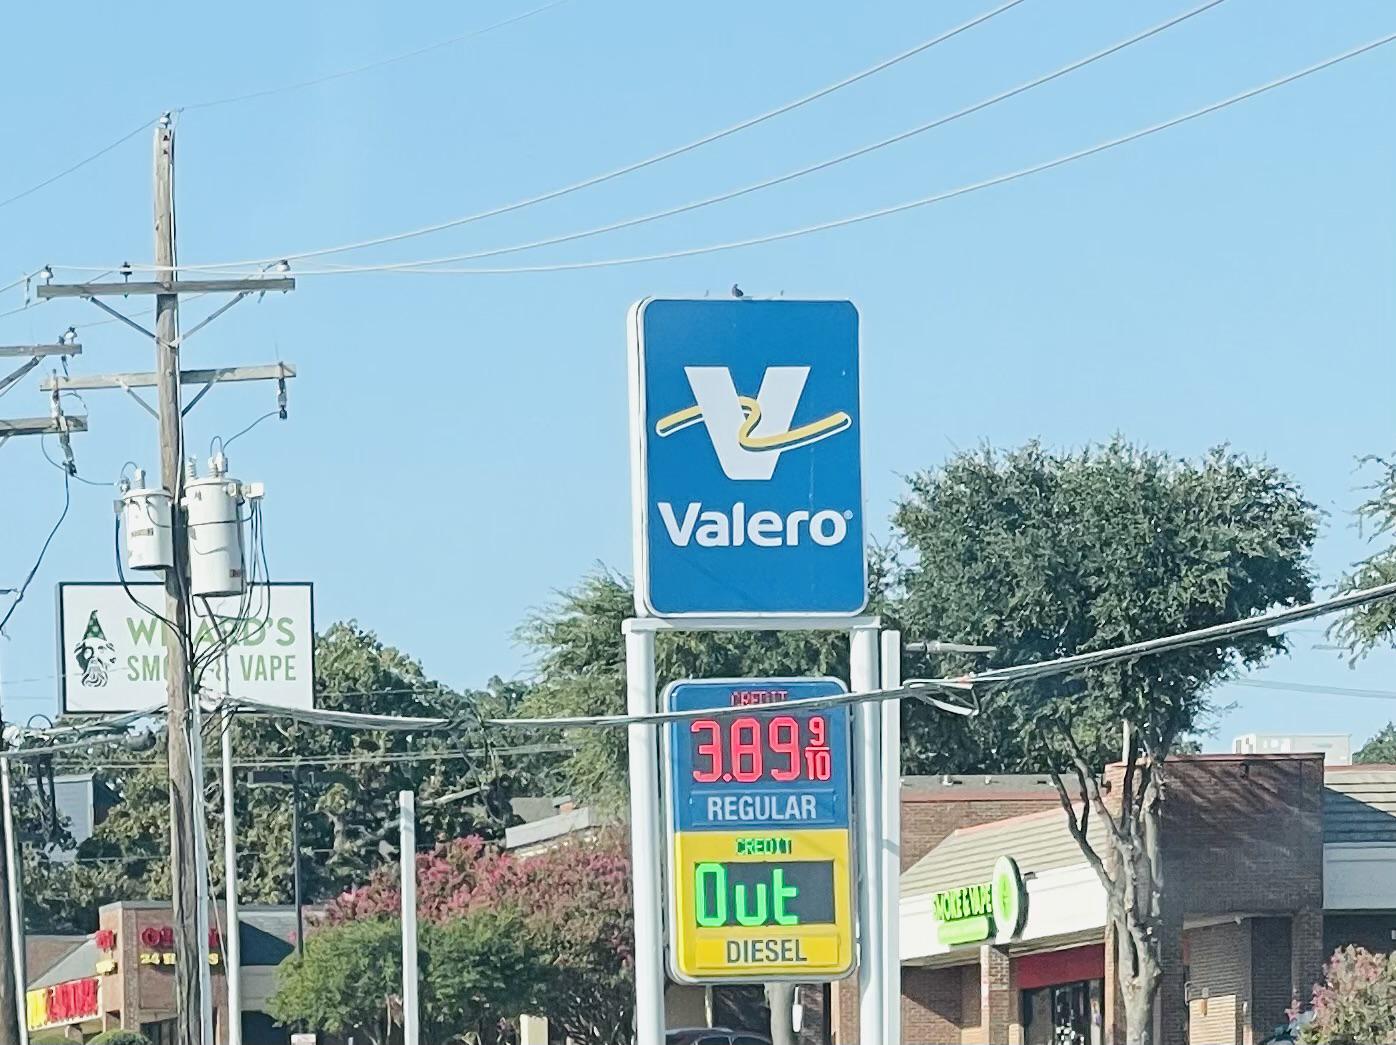

Refinery Bottlenecks Drive 8-12% Freight Cost Surge | Seller Logistics Strategy 2025
- Aging refinery infrastructure creates sustained fuel price pressure affecting air cargo, ocean shipping, and ground transportation costs for cross-border sellers through 2025














Overview
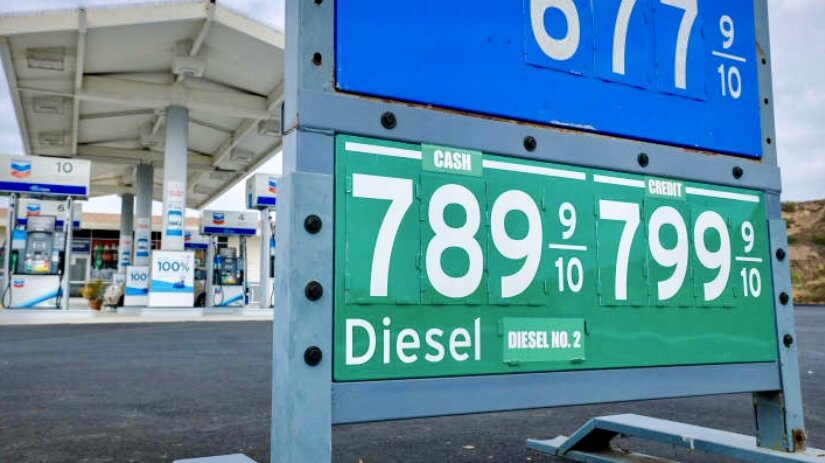
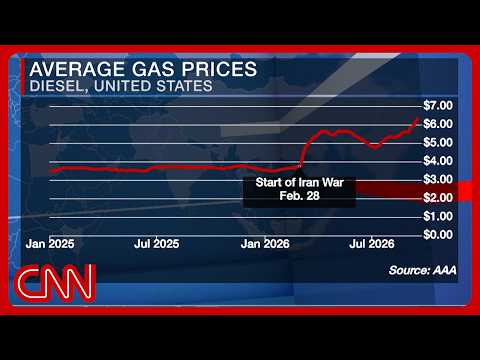
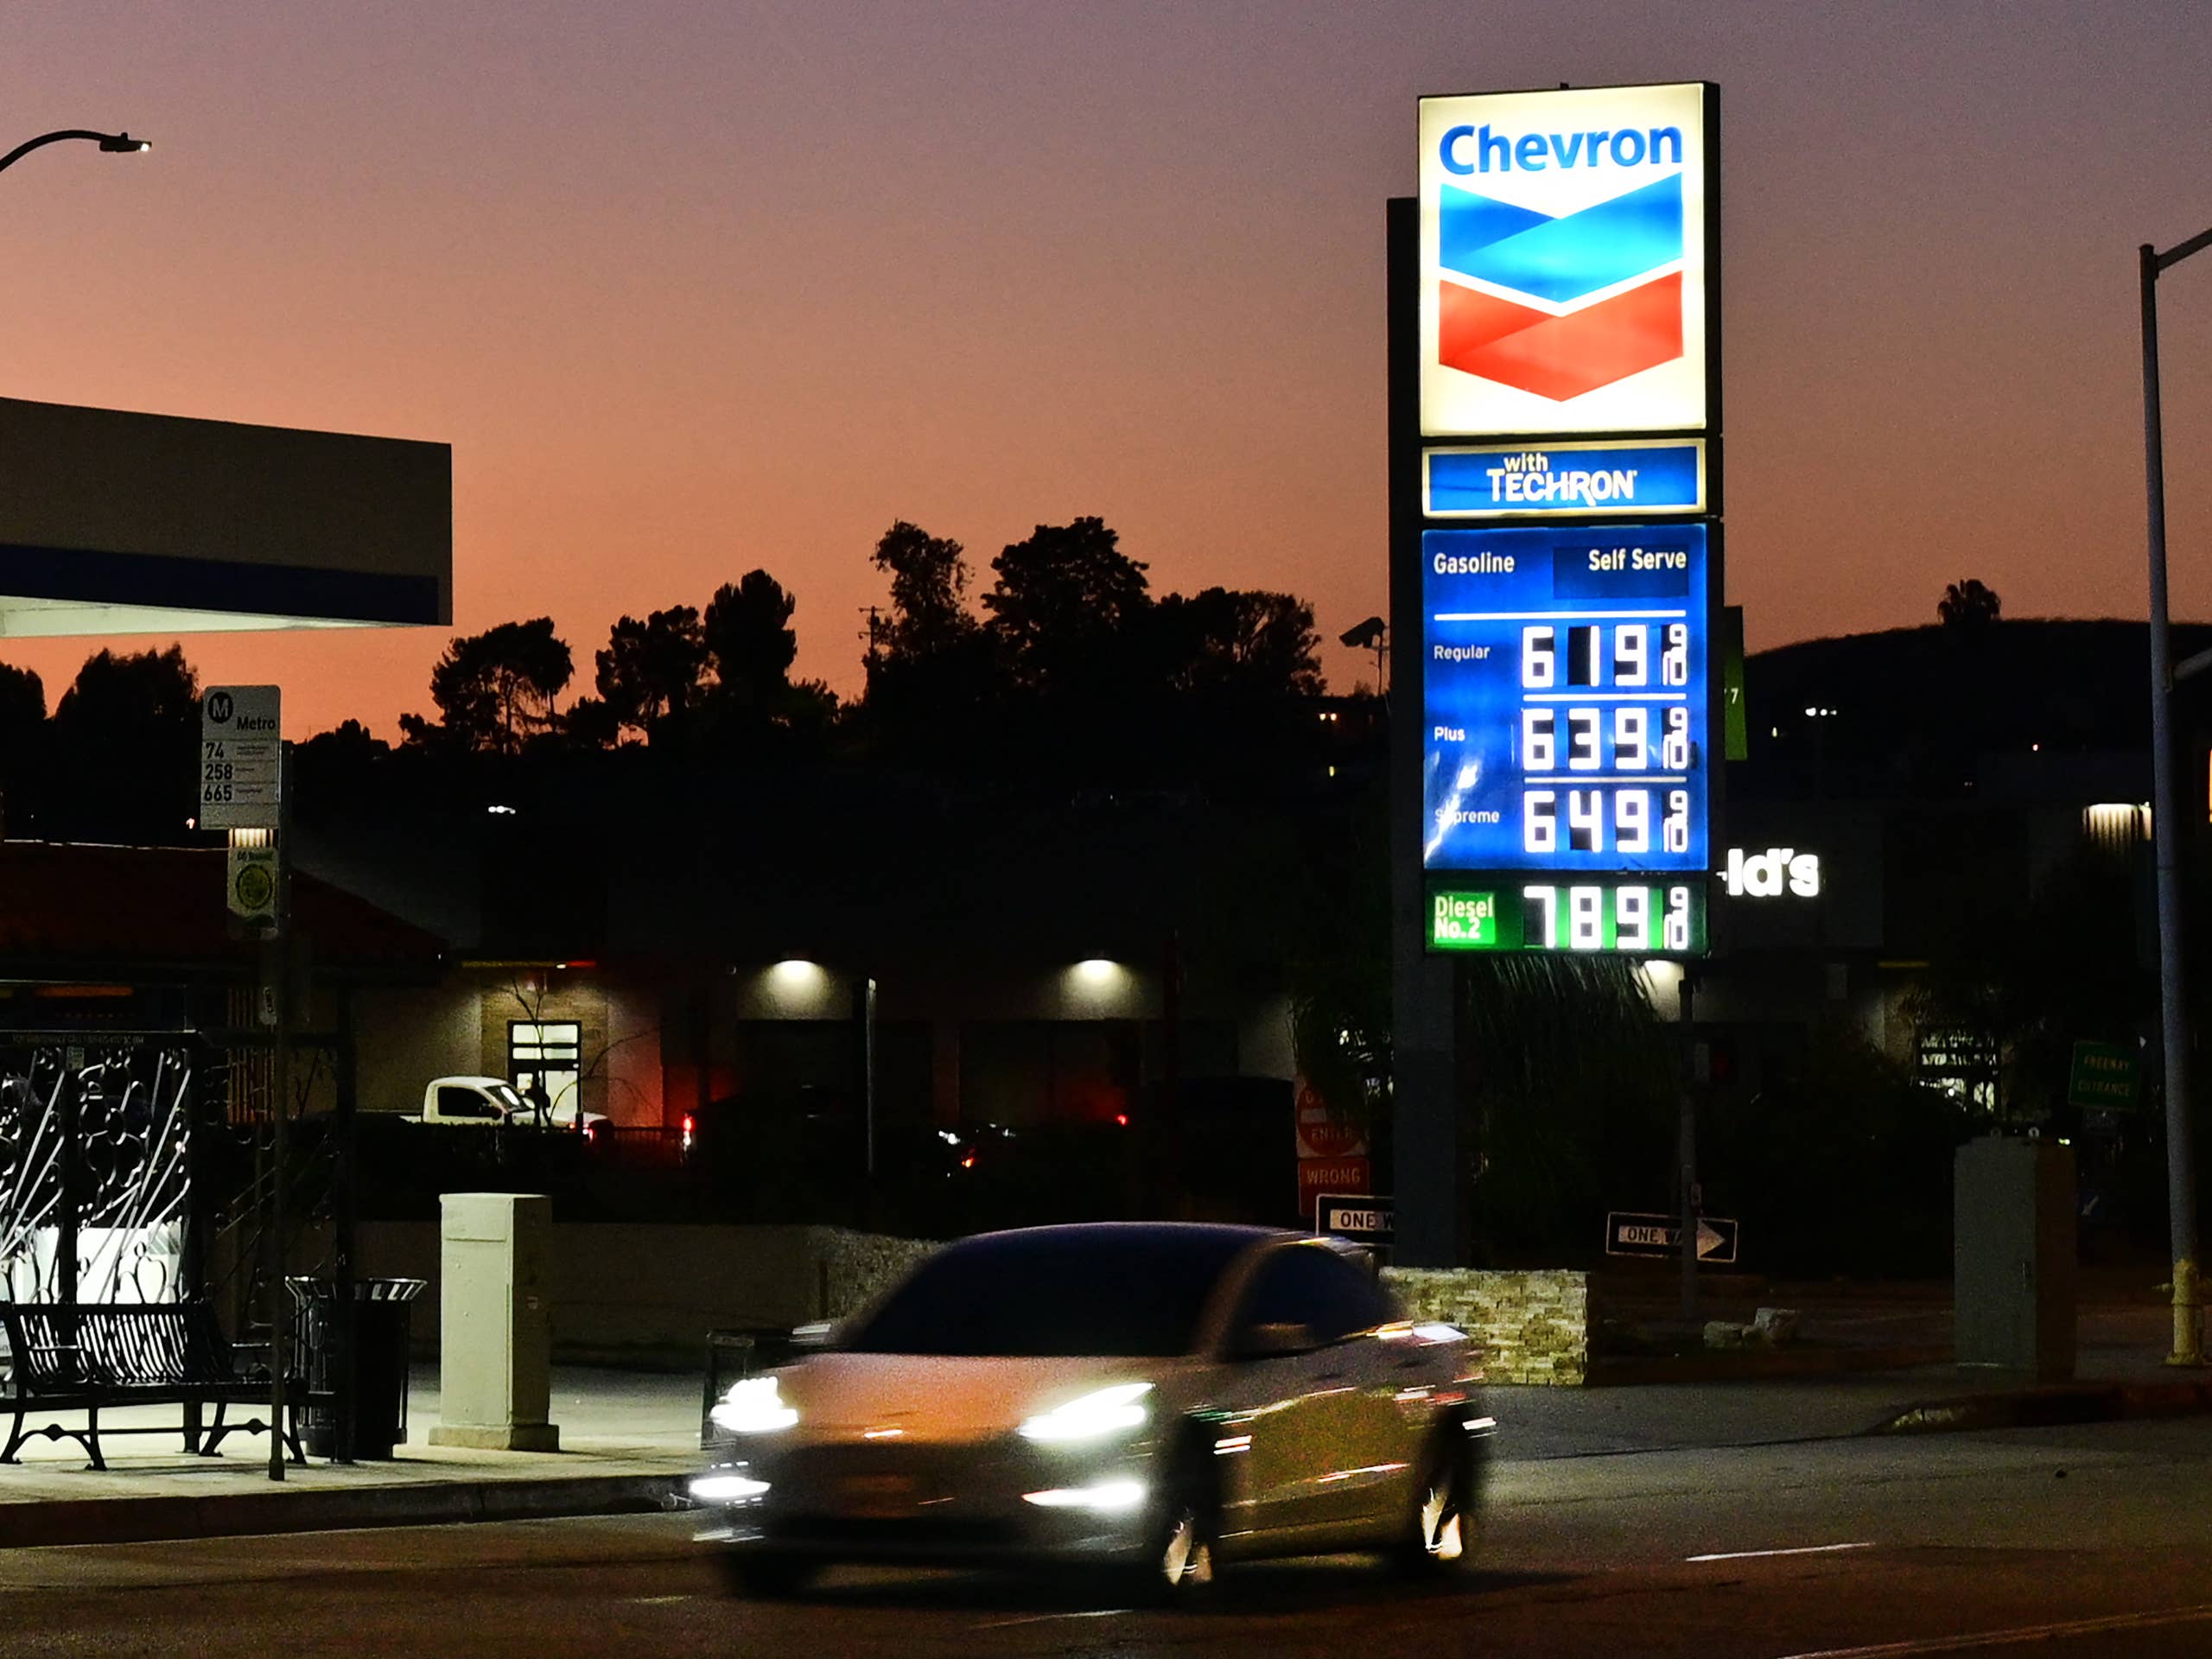
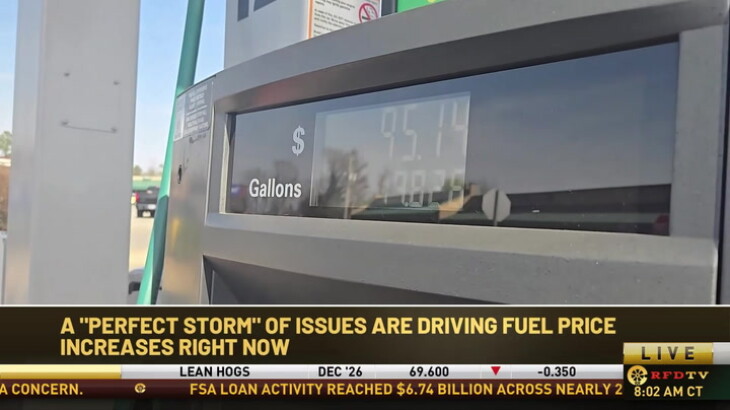
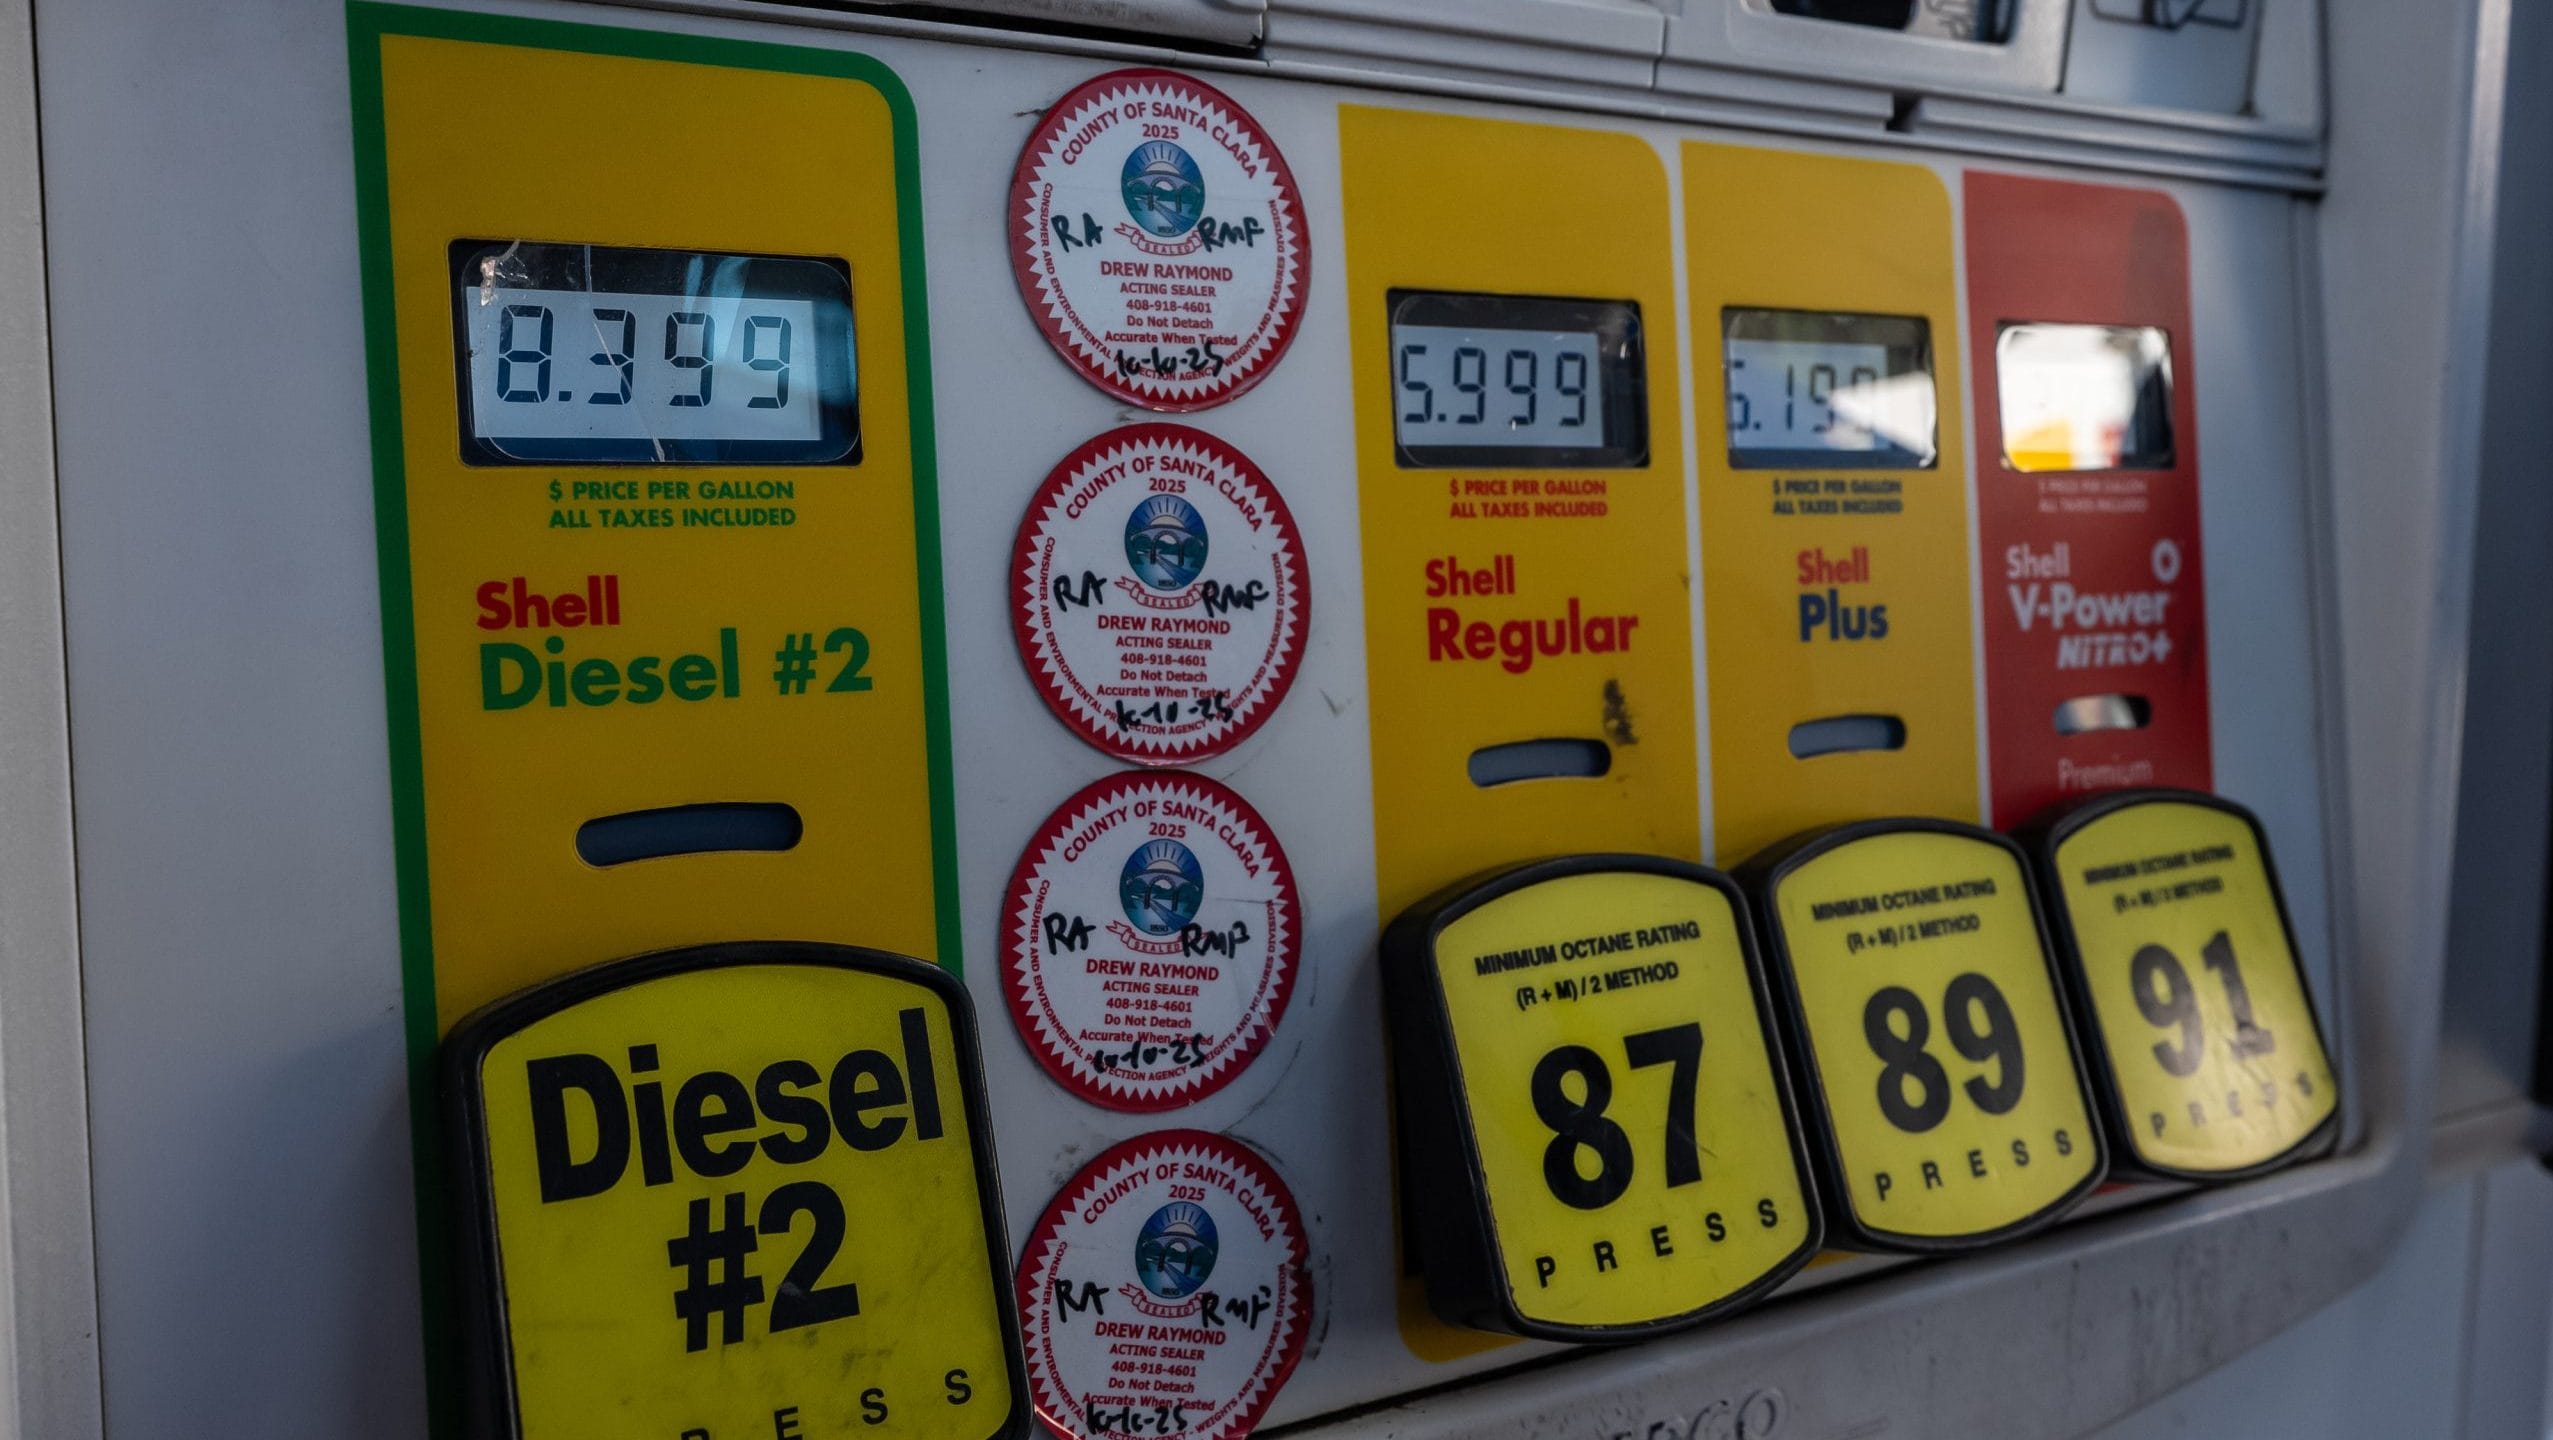
Global refinery capacity constraints have emerged as the primary bottleneck in energy supply chains, directly impacting cross-border e-commerce logistics costs through elevated fuel surcharges. According to Wall Street Journal analysis, aging refinery infrastructure, limited new capacity additions, and geopolitical disruptions have created significant supply constraints that surpass crude oil extraction or transportation concerns. This structural energy challenge translates directly to seller economics: air freight rates typically incorporate 12-18% fuel surcharges, ocean shipping adds 8-15% fuel adjustment factors (FAF), and ground transportation costs rise 5-8% during periods of constrained refining capacity.
For cross-border sellers, the refinery crisis creates three distinct cost pressures. First, time-sensitive logistics (air cargo, express shipping) face acute margin compression—sellers shipping electronics, apparel, or perishables via air freight to US/EU markets should expect $0.15-0.35/kg additional costs compared to 2024 baseline rates. Second, energy-intensive manufacturing regions (China, Vietnam, India) experience elevated production costs that suppliers pass through to wholesale prices, affecting landed cost calculations by 3-7% for categories like electronics, home goods, and textiles. Third, last-mile delivery and fulfillment center operations consume significant fuel; Amazon FBA sellers in high-volume categories (electronics, beauty, home) face potential storage cost increases as warehouses absorb elevated energy expenses.
Strategic response requires immediate inventory and routing optimization. Sellers should shift 20-30% of time-sensitive inventory from air freight to ocean freight where lead times permit (consolidate shipments, extend planning windows by 2-3 weeks). For Q1 2025, prioritize stocking energy-efficient product categories (lightweight electronics, digital goods, apparel) in US/EU warehouses before fuel surcharges potentially increase further. Consider diversifying fulfillment across 3PL providers in lower-energy-cost regions (Mexico for US market, Eastern Europe for EU) rather than concentrating inventory in high-cost hubs. Monitor carrier announcements from DHL, FedEx, and UPS for fuel surcharge adjustments—these typically update quarterly and represent early signals of sustained energy cost pressure.
Questions 8
Should I shift from air freight to ocean freight to save costs?
Yes, for non-urgent inventory. Ocean freight costs $0.15-0.35/kg versus $0.80-1.40/kg for air, but requires 25-35 day lead times versus 5-7 days. Strategy: shift 60-70% of inventory to ocean freight with 8-12 week planning windows, reserve air freight for high-velocity SKUs and seasonal peaks. For Q1 2025, begin ocean shipments by mid-December 2024 to avoid January fuel surcharge increases. Calculate break-even: if holding cost is $0.05/kg/week, ocean freight saves $0.50-1.00/kg despite longer transit, making it optimal for 80%+ of inventory.
How do refinery constraints affect Amazon FBA storage costs?
Indirectly but significantly. FBA fulfillment centers consume substantial energy for climate control, lighting, and material handling. As energy costs rise 8-12%, Amazon may increase storage fees by 2-5% in 2025 (currently $0.87/unit/month for standard-size items). Sellers should optimize inventory velocity: reduce IPI (Inventory Performance Index) risk by maintaining 90+ day inventory turns, avoid long-term storage fees ($6.90/unit for items stored 365+ days), and consider FBM (Fulfillment by Merchant) for slow-moving SKUs. Monitor Seller Central announcements for Q2 2025 fee changes.