


Silver Price Crash 36% | Precious Metals Volatility Signals Supply Chain Disruption for Electronics & Solar Sellers
- Silver plunges 11-36% in February 2026 after 146% 2025 rally; industrial demand from solar/electronics manufacturing faces 7-14 year recovery timeline affecting component sourcing costs




















概览
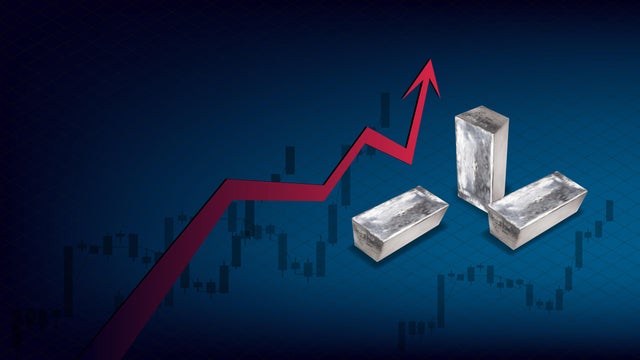
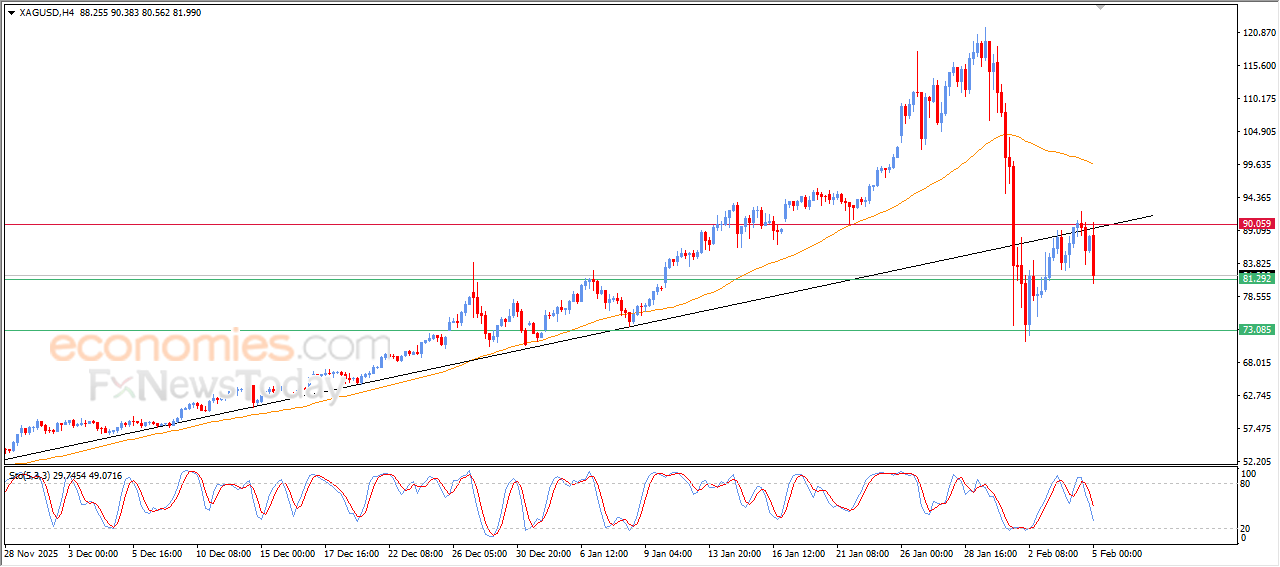
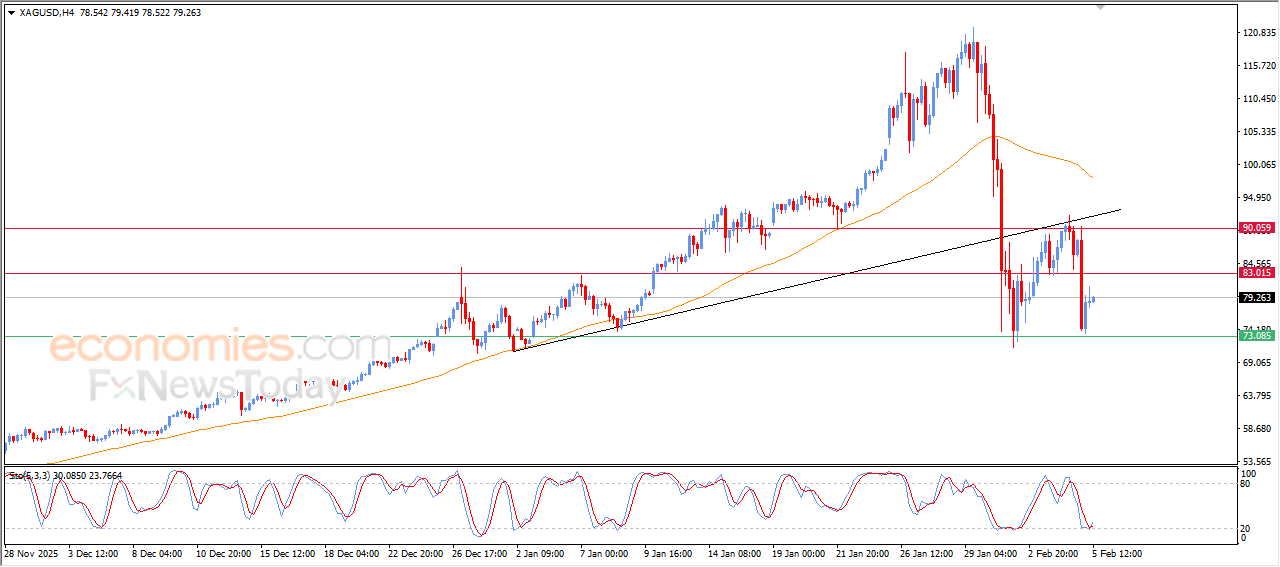
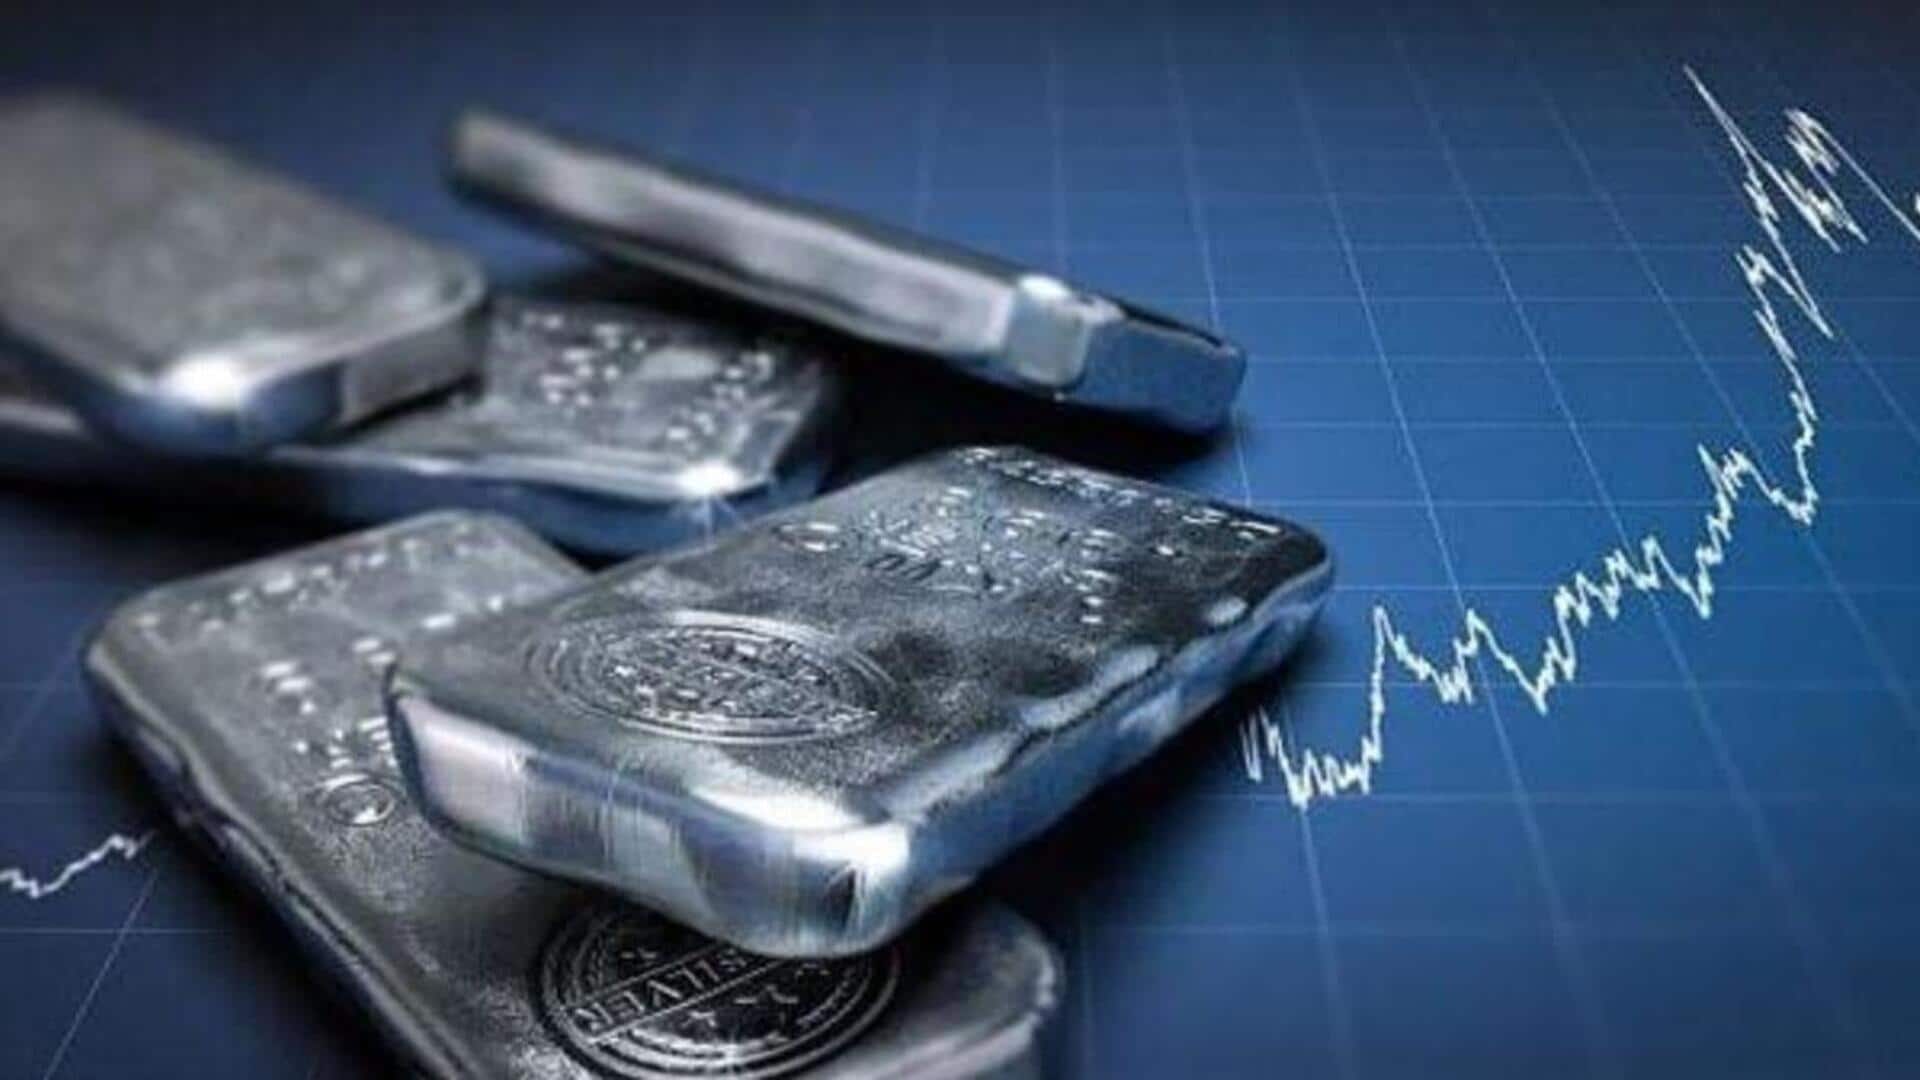
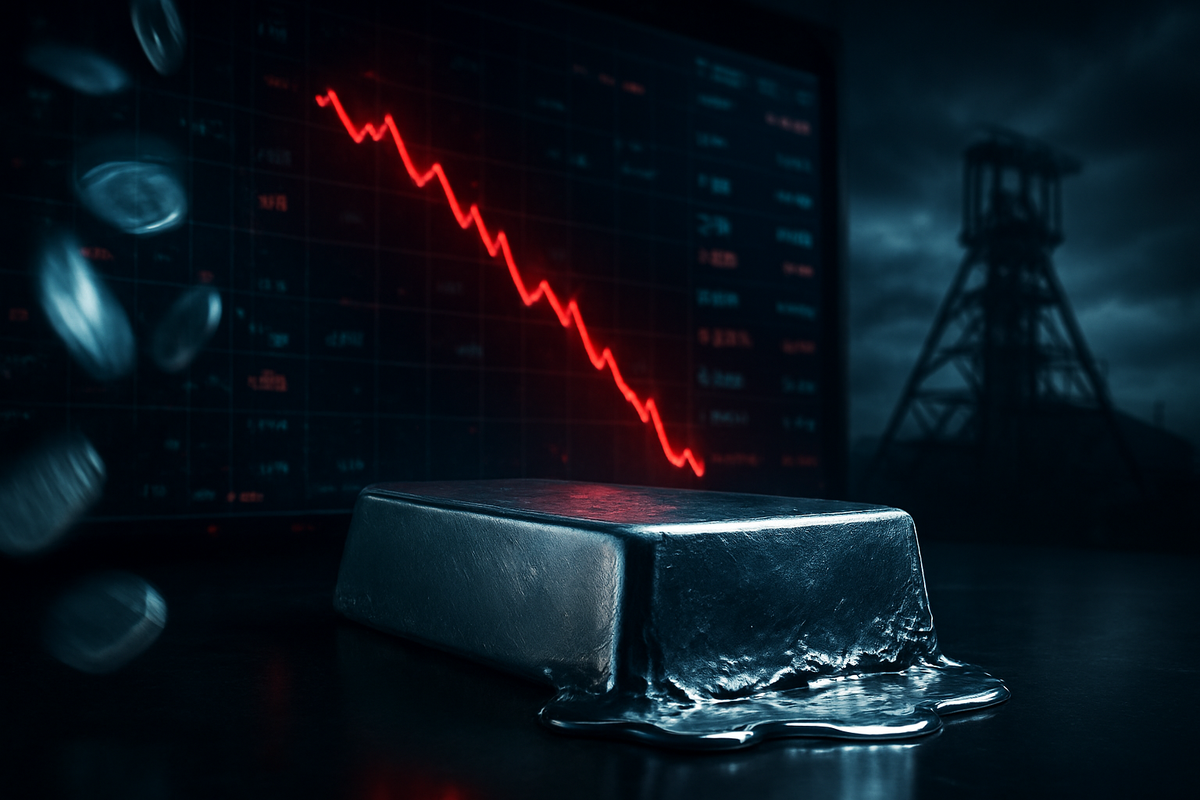
Silver's dramatic 36% correction in early February 2026 represents a critical inflection point for e-commerce sellers sourcing electronics, solar components, and industrial products. Spot silver traded around $78.38/oz after plunging 11% on Thursday and 36% the previous Friday, following a 146% rally throughout 2025. While this appears to be a pure commodities story, the underlying volatility directly impacts three major seller categories: (1) electronics manufacturers relying on silver for circuit boards and connectors, (2) solar panel suppliers dependent on silver paste for photovoltaic cells, and (3) industrial equipment sellers using silver in catalysts and manufacturing processes.
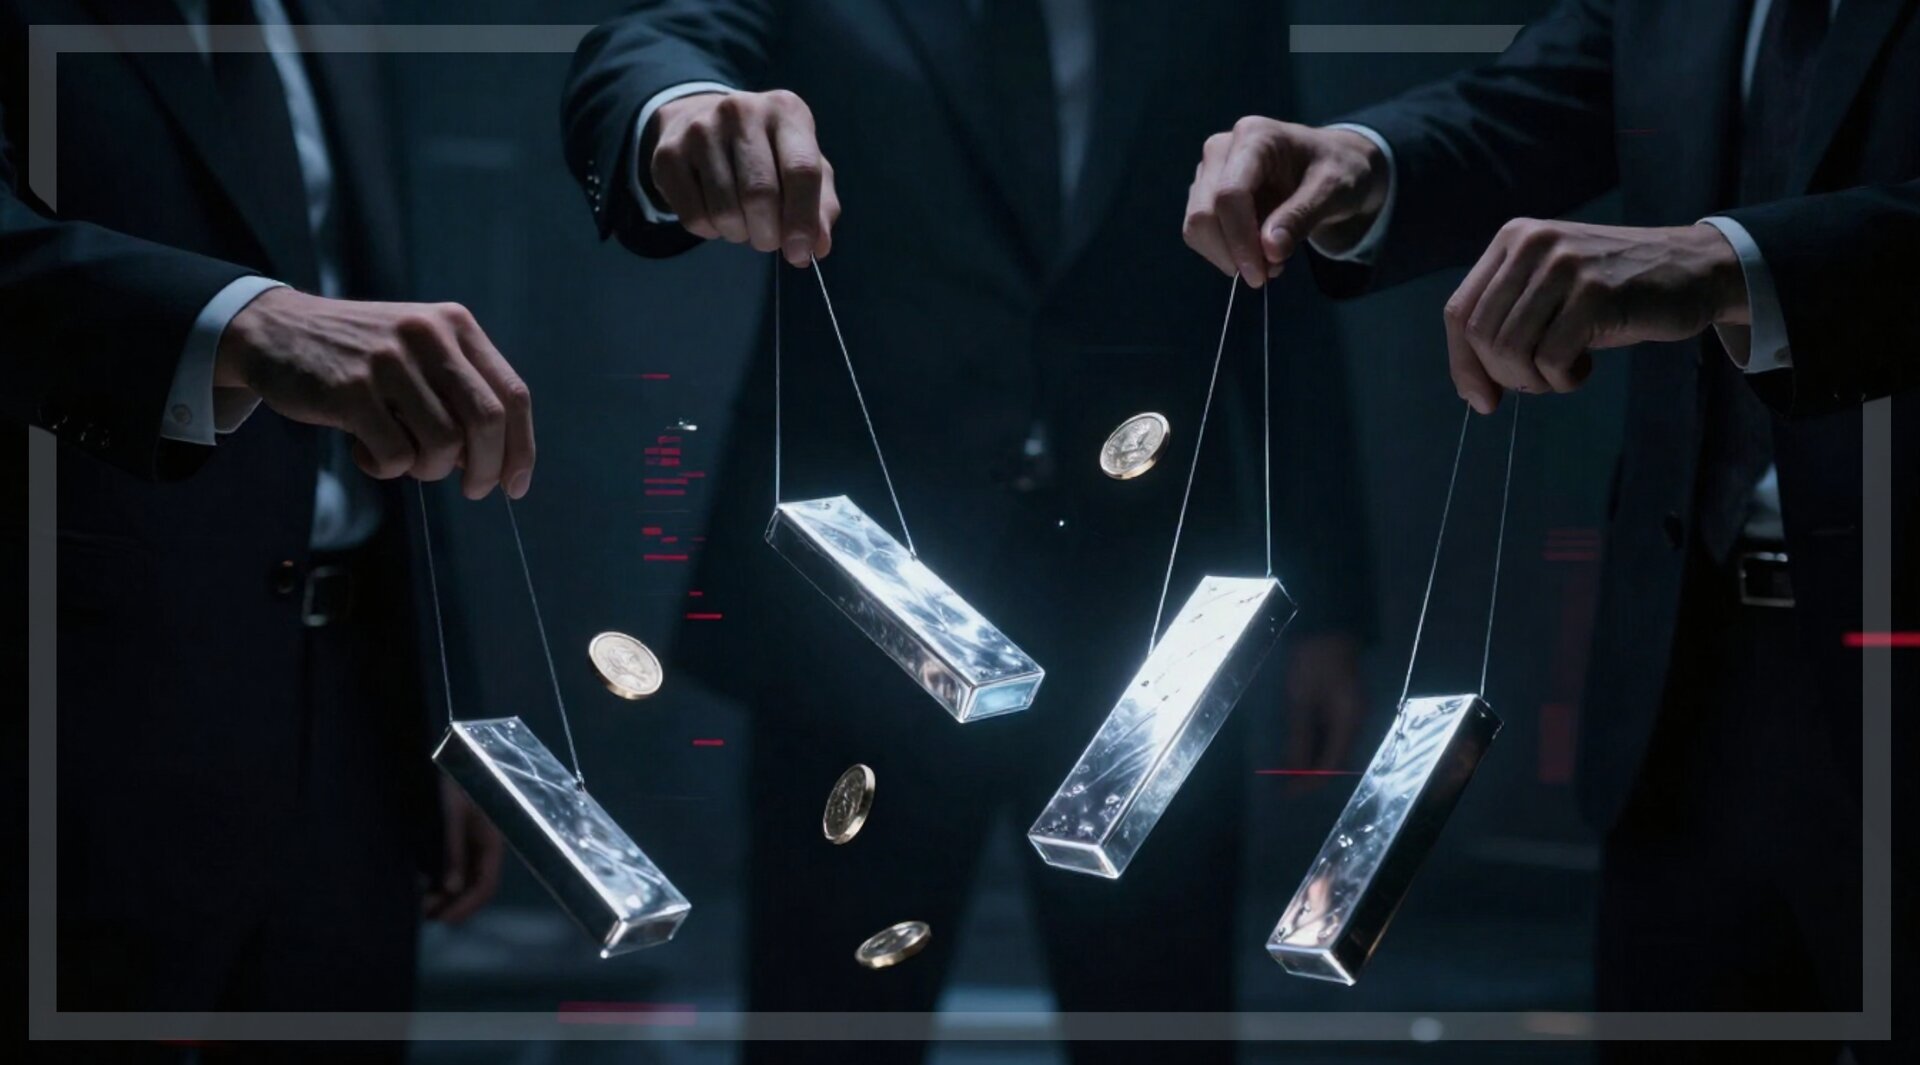
The volatility stems from speculative positioning rather than fundamental demand destruction. Analysts including Sunil Garg (Lighthouse Canton) and Steve Sosnick (Interactive Brokers) attribute the extreme swings to leveraged trading, options-driven flows, and momentum-driven speculation comparable to meme stocks like GameStop—not reduced industrial consumption. The CME Group's margin requirement increases and Goldman Sachs' analysis of dealer hedging flips indicate the market is correcting speculative excess, not signaling fundamental weakness in silver's industrial applications. This distinction is critical for sellers: the price crash reflects financial engineering, not reduced demand from solar manufacturers or electronics producers.
However, Ned Davis Research's historical analysis presents a sobering 7-14 year recovery timeline that directly impacts long-term sourcing strategy. NDR data shows silver has experienced only four corrections exceeding 20% from all-time highs in 58 years, with each requiring an average of 7 years to find a bottom and 14 years to reach new record highs. The current episode shows "most similarities to the 1980 collapse" when silver fell 93% over 13 years. Despite the recent decline, silver remains up 24% year-to-date in 2026, suggesting the correction may continue for 12+ months. For sellers with silver-dependent supply chains—particularly solar component manufacturers and electronics assemblers—this creates a 12-24 month window of potential cost volatility before stabilization.
The London market's tight liquidity conditions magnified silver's correction relative to gold (which declined only 1.7%), indicating supply chain concentration risk. Western trading flows (not Chinese speculation) drove most volatility during Chinese futures market closures, suggesting global supply chain dependencies on London-based silver trading. Sellers sourcing silver-intensive components should diversify suppliers and consider hedging strategies or inventory timing around the 12-month downside pressure window identified by NDR analysts.
問題 8
Should sellers hedge silver exposure or wait for further price declines?
Historical precedent suggests waiting: NDR's analysis of four major corrections in 58 years shows silver averaged 7 years to find a bottom, with 65% peak-to-trough declines. The current episode mirrors the 1980 collapse pattern most closely, indicating extended downside pressure. However, the volatility is speculative (leveraged positioning, options trading) rather than demand-driven, meaning industrial consumption remains stable. Sellers should: (1) avoid long-term fixed-price contracts until March-April 2026 when speculative unwinding completes, (2) negotiate quarterly price adjustments with suppliers, (3) consider 3-6 month forward contracts rather than annual commitments. Hedging through futures is expensive given CME margin increases, making strategic timing more cost-effective than derivatives.
How does silver price volatility affect electronics and solar component sellers?
Silver is a critical material in circuit boards, connectors, and solar photovoltaic cells, representing 3-8% of manufacturing costs in high-end electronics. The 36% price crash in February 2026 creates immediate sourcing uncertainty: sellers who locked in high-price contracts during 2025's 146% rally face margin compression, while those delaying purchases risk further downside if the 12-month correction timeline holds. Ned Davis Research indicates silver may trend lower for at least 12 months before stabilizing, suggesting sellers should time component purchases strategically rather than panic-buying at current levels. For solar panel suppliers specifically, silver paste costs directly impact module pricing competitiveness on Amazon, eBay, and B2B marketplaces.